TraderFOREX21
4HR TIME FREAME CHART, Strong uptrend since start of November, setup for a long opportunity with target price at previous high of $1.89. Support at $1.841.
WEEKLY timeframe chart. USDJPY has reached weekly high @ 113.7, this sets up for a potential shorting opportunity as we will see it moving towards the downside after weekly highs. We can also see that RSI is OVERBOUGHT is at 74+. ATTENTION !!! This should NOT be taken as a piece of professional advice just my speculation.
DAILY TIMEFRAME CHART, After reaching Previous support levels on a DAILY time frame we look to take a long position and take profit at 0.618 fib retracement level. RSI(14) has reached the 30 levels on the daily timeframe. ATTENTION !!! This should NOT be taken as a piece of professional advice just my speculation.
30-MIN chart, After reaching Previous support levels on 30 min time frame we can see the formation of a "falling wedge" pattern with a potential of a breakout, RSI can be seen below 20 on 30min time frame. ATTENTION!!! This is not a professional advice just my speculation.
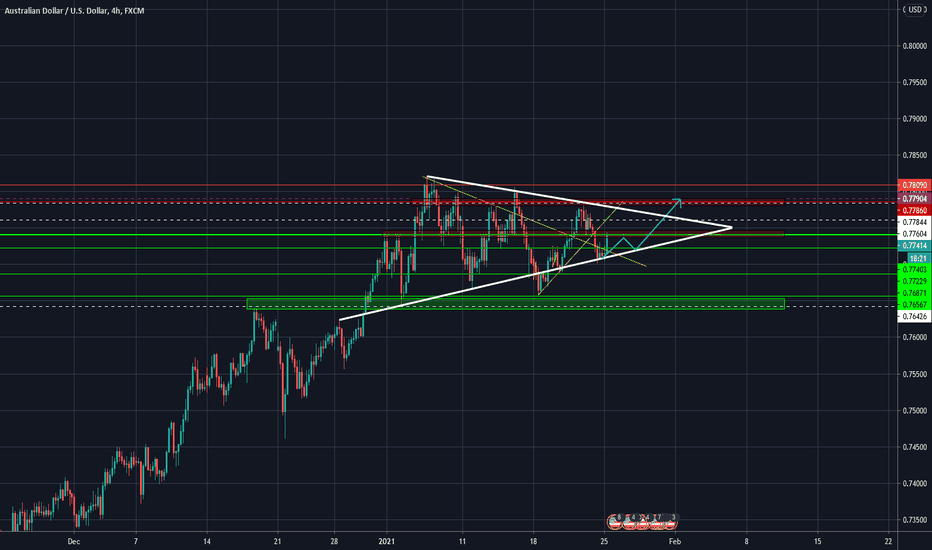
As shown on my previous idea that aud/usd could complete the "W" formation, now that formation is made AUD/USD reaching the previous resistant level at 0.78100 and it is likely to come down presenting a short opportunity. This is not a professional advice just my speculation.
2H chart, Potential Long position after reaching previous support levels with. RSI likely to continue uptrend well above 70. AUD/USD likely test previous resistance at 0.78100 level With the formation of "W". Stoch RSI forming upward momentum as well.
It could follow the trend, potential short term long position
Watch the key levels support and resistance for entry and exit. Just my idea


