$MOMO Price action on the hourly has broken the Kumo Cloud upward Chikou Span is above the current price action, although within the cloud Price is above it's higher time frame 13-period EMA and above it''s current time frame 13-period EMA
- S&P is trading above its 100-period SMA, which has turned green, illustrating positive price momentum - Breadth ratio is < 2.0, which is a weak bullish signal, but is starting to gain positive momentum - Net Advance Decline Line is still < 1000, which is a "not as strong" bullish signal, but is above its 21-period EMA and is rising quickly to break 1000
Overall, the AMEX:SPY was trading below its 100-period SMA for a majority of the day, with the 5-minute chart well below the 100-period SMA - Breadth Ratio ( NYSE:UVOL / USI:DVOL ) was showing a ratio of greater than 2.0 which a sign to look for bearish/shorting opportunities on the day - Net Advance/Decline Line ( USI:ADVN.NY - USI:DECL.NY ) was below...
Check out Networthie.com to share your thoughts on effective trading strategies and systems. Would love to hear your ideas. - Market Internals today 07/18 are calling for a continuation of bullish action tomorrow morning. - That being said, market internals can quickly change, i.e. the S&P 500 starts to trade below its 100 SMA and the Breadth Ratio reverses...
- Snapshot of the Market Internals for July 18, 2016 - S&P 500 index was trading above it's 100-period simple moving average, which is a sign for positive price action - Breadth Ratio (UVOL to DVOL) was less-than stellar with volume flowing into securities increasing over volume flowing into securities decreasing at a ratio of less than 2.0x for a majority of...
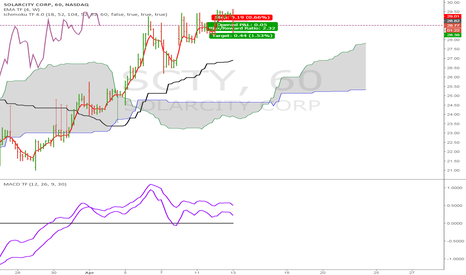
Going off of the 5 minute charts. Risk Reward 1:2, - Entry 28.82 -Stop at Kijun-Sen 29.05 -Target 28.38 Intraday Trade. Intraday MACD < 0 and Higher Timeframe MACD turning down but still above zero
- MACD Timeframe Indicator (12, 26, 9) Hourly and Daily Timeframes showing bullings patters as both are > 0 and MACD > Signal Line - Ichimoku Indicator pointing higher with Kijun Sen above the Kumo Cloud and Price above the Kijun Sen
HES Daily Chart has an RSI hovering around the 60-support level. HES Intraday chart, look for bullish price action with Kumo Breakouts for entry (1 min, 5 min, 15 min)
Longer Time Frame Daily Chart has a rising long term MACD.
Price continuation through the Ichimoku Cloud on the 1-hour chart on HES. Tenkan-Sen above the cloud and above the Kijun-Sen. Look for oversold signals on the Stochastic for entr [ /image]ies or support along the Cloud


