Bitcoin Dominance Peaked Finally 🚀 🚀 You can see in the image that Bitcoin Dominance is now Breaking its Bullish Structure, and clearly indicating that it's topped and Altseason is ready 40x to 50x gains are coming for you if you are still here surviving all the pain and Blood in past years and months. Congratulations to you. People will call you lucky but they...
The Final Level of Bitcoin Dominance: Where the Altcoin Season Begins Bitcoin Dominance (BTC.D) has long been a critical indicator in the crypto market — a gauge of how capital is distributed between Bitcoin and the rest of the altcoin market. Over the past months and years, we’ve watched Bitcoin's dominance fluctuate, often controlling the direction and...
- BTC Dominance Nearing 0.786 Fibonacci Level – Altseason on the Horizon? Bitcoin dominance, which measures BTC’s market cap relative to the total cryptocurrency market, is currently approaching a critical technical level — the 0.786 Fibonacci retracement, precisely around 66.20%. Historically, this level has acted as a strong resistance zone, often signaling...
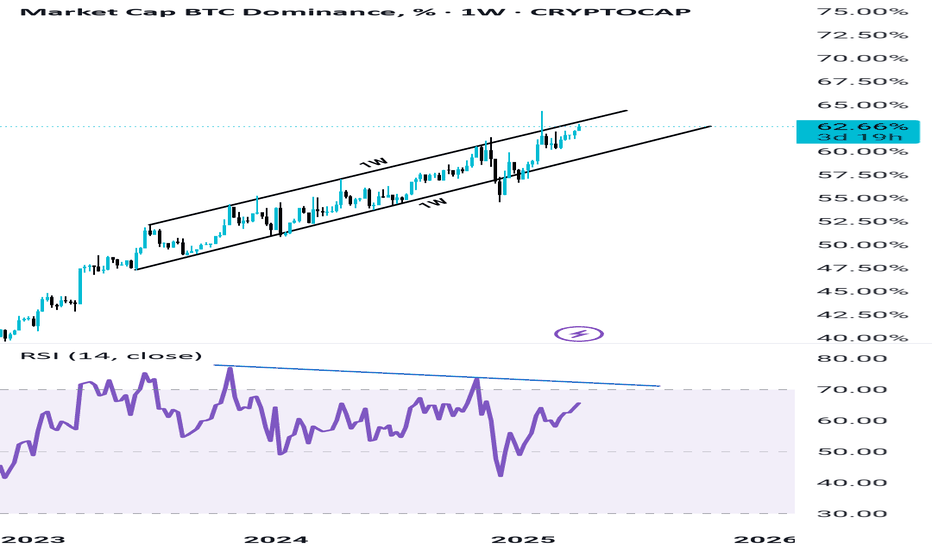
Bitcoin's dominance has failed to establish a new high, suggesting a significant weakening and a lack of upward momentum. This failure strongly indicates that Bitcoin's dominance is poised for a reversal from this point, potentially initiating a new downtrend. Furthermore, a compelling bearish divergence is forming on Bitcoin's dominance on the weekly timeframe's...
Usdt dominance is finally topping out and going to start it's new downtrend And massive bull run in Bitcoin and your altcoins as well like i have discussed with you in my previous ideas you can check them out. But 3.7% support is now weak My potential targets for usdt dominance reveal is approx 2.7 and 2.5 range So plan accordingly don't exit too early and don't...
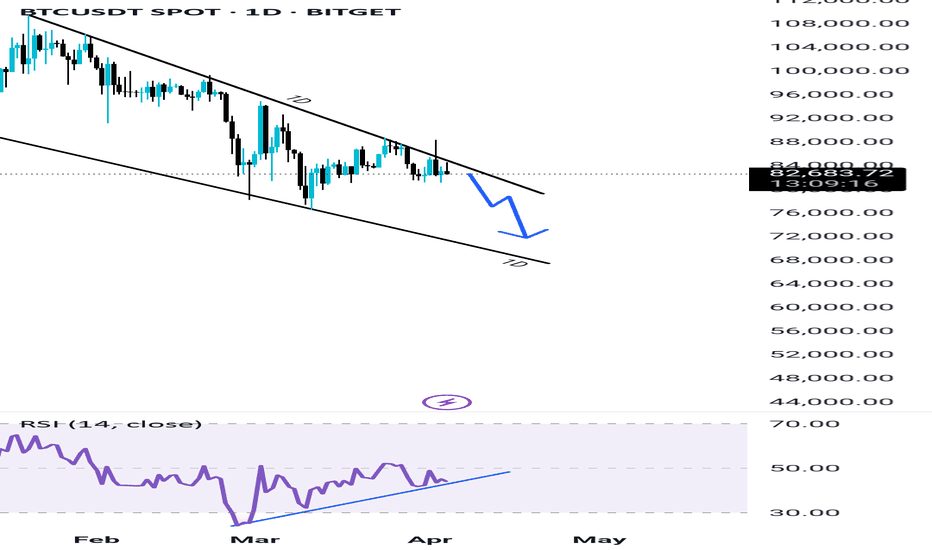
I'll Short BTC if I see it at 86k once again Too much weakness on 4h time frame But I'll use a tight stoploss there above the high My tp will be at 81000 or 80000 But at the end I'll definitely wait for the confirmations on the lower time frames because without confirmations it's total loss in trading. This trade is 1:10 risk to reward So it does not...
USDT Dominance is currently heading toward a key demand zone between 5.33 and 5.16, which could act as a strong support area. From this zone, we might witness a short-term bounce or upward movement. This could temporarily cause corrections in both Bitcoin and altcoins, so don't be alarmed—this is a healthy part of market behavior. After a possible slight move...
Bitcoin Dominance Is Very Close to a Downtrend – Altcoin Season Is Near Bitcoin dominance is likely to enter a downtrend soon—because no uptrend lasts forever. This shift may occur within just a few weeks. As you can see in our current Scenario1 , Bitcoin dominance might sweep its previous high and reverse from there. However, if a daily candle closes above...
BTC Price Action Analysis: Short-Term Correction Insight Bitcoin (BTC) is currently undergoing a short-term correction, likely heading towards the $78K zone to retest its demand area. This is a natural move in market structure, so there’s no need to panic. The retest of this level could provide the necessary momentum for a bounce back toward the upside, aligning...
Alright, so while the daily chart might have some folks calling for a bear market, let's zoom out to the weekly timeframe for a different picture. See how things are still looking pretty bullish there? That daily dip might just be a healthy correction in the grand scheme of things. Don't be shocked if we see a quick move down, maybe even a wick into that $60k-...
Bitcoin (BTC) could experience a drop to the $66,000–$68,000 range as market sentiment reacts to the United States imposing a significant 104% tariff on Chinese imports. Such a drastic trade measure can trigger global economic uncertainty, causing investors to move away from riskier assets like cryptocurrencies. Historically, geopolitical tensions and trade wars...
USDT Dominance & Bitcoin Market Analysis As I mentioned earlier, when USDT dominance moves to sweep its previous high, Bitcoin automatically drops while USDT dominance rises. That’s exactly what happened, and once again, our prediction turned out to be accurate. However, there’s nothing extraordinary about this—we simply present our analysis. Sometimes, we are...
Bitcoin Bottom Analysis and Future Outlook In my opinion, BTC has already formed its bottom. I believe this because the lows are fully protected, meaning no candle has closed below the previous low on the daily timeframe. This is a strong indication that we have established a bottom. Additionally, the 74-75K area was a very strong support zone from which we saw a...
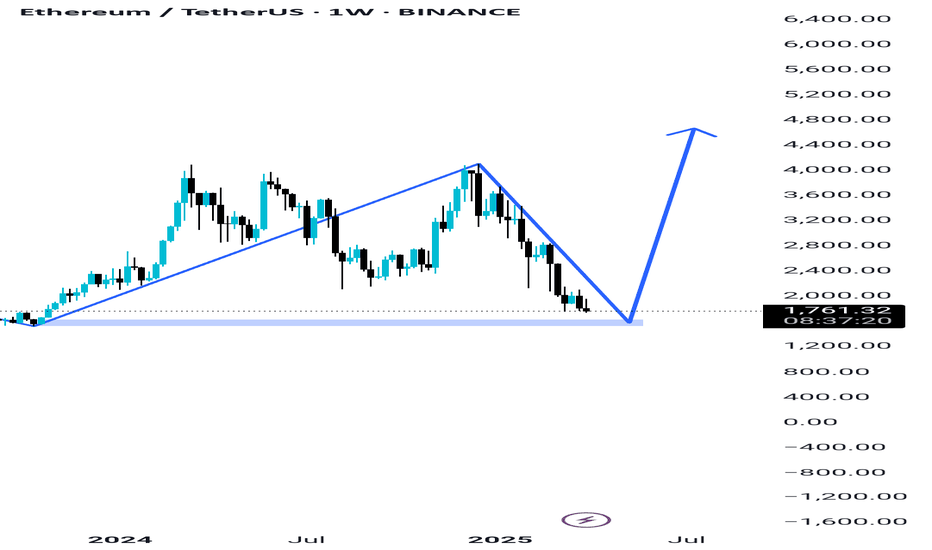
Ethereum (ETH), being one of the most dominant cryptocurrencies in the market, often experiences significant price fluctuations driven by market sentiment, institutional interest, and macroeconomic conditions. A critical price range to watch for accumulation is between $1632 and $1521, which serves as a strong demand zone for both long-term investors and...
BTC Struggles to Break Trendline Resistance: Signs of Weakness on 1D Timeframe Bitcoin is currently facing strong resistance on the daily (1D) timeframe, struggling to break above the trendline. This indicates potential weakness, with BTC showing signs of a downside move towards the $70K–$75K range. While we cannot pinpoint an exact support level, this zone...
BTC Dominance Showing Signs of Weakness – Altseason Incoming? BTC dominance is finally topping out, displaying clear signs of weakness. Rising wedge Pattern forming on weekly time frame which is also bearish. Despite reaching new highs, momentum appears to be fading, with bearish RSI divergence further confirming the exhaustion. All indicators point towards an...
BTC.D In this scenario, if USDT.D fails to create a new high or even an equal high and starts melting down, it could indicate a bearish structure forming—specifically, a Head and Shoulders pattern. This pattern often signals a reversal, meaning USDT.D could continue dropping. If this happens, it would likely lead to BTC dominance (BTC.D) rising, as capital...
Understanding the Market Move: USDT.D, BTC.D, and BTC Price Action Currently, USDT Dominance (USDT.D) is approaching a key level, sweeping its previous high. This indicates that traders are moving funds into stablecoins, usually a sign of risk aversion. Due to its inverse correlation with Bitcoin (BTC), this movement suggests that BTC may experience further...


