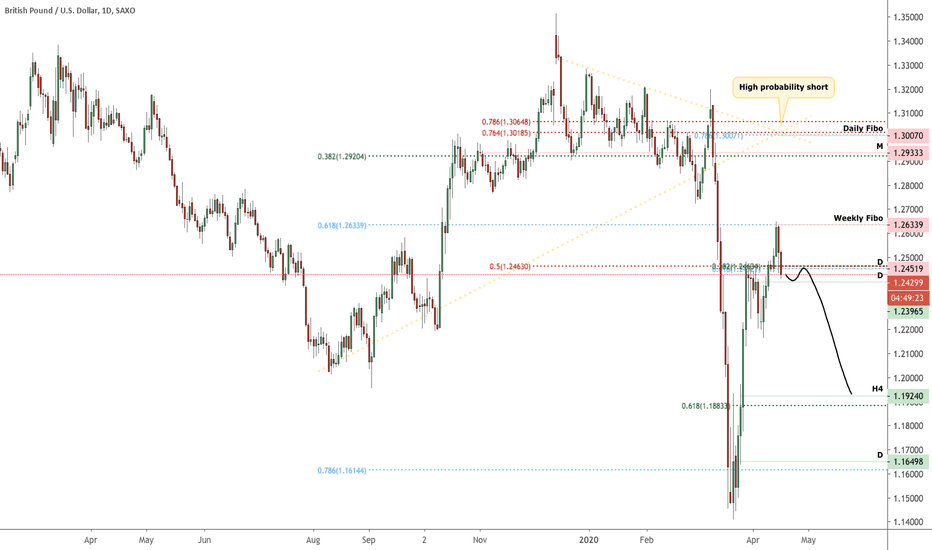
Waiting for break of either support or resistance to confirm direction, trading within a range now
Nearing strong support, need to wait for breakout confirmation of key support level to go short. Consider playing short term bounce to monthly resistance, still waiting for breakout confirmation similar to the wait on EUR/USD before going short
Pending short order base on daily chart, 2 ways price could pan out based on the blue and black lines, could see one more spike to nearest 61.8% extension
Overall bearish view, break of trendline & previous weekly support, breakout confirmation already happened, chance to enter on pullback
Waiting for confirmation of breakout. Potential breakout of trend line, need price to close below current support level at 1.07974 to confirm breakout & enter on pullback
Pending market order with daily chart view, wait for breakout confirmation before entering pending sell limit 2 orders, daily chart, strong reversal below weekly fibo & break of key previous support level, bearish view, waiting for confirmation to enter on pullback Linked ideas :https://www.tradingview.com/chart/GBPUSD/PtuHvKHq-GBPUSD-Daily/
Open market order with daily chart view. Potential risk could be that it is too early to call breakout, but there was a clean breakout pullback on H4 so it is worth a shot. Could see another retest of 0.63000 level before drop
- Updated previous AUDUSD H4 chart with another potential limit order - First trade opened market order
Strong reversal off weekly fibo from recent high, waiting for breakout confirmation on H4 to go short on pullback On a side note, strong resistance zone if price makes a further push to M and daily Fibo level, can consider a short at 1.3007
Price could drop lower to weekly level, breakout pullback on H4, price could drop lower. Took a short on H4 time frame with this view Potential long at weekly support or short on breakout pullback of level
Hey everyone, here's the analysis on Zoom. If you find this insightful, please follow and like our idea, also leave a comment on ideas you would like to see next! Summary: Current price is within our resistance zone and it could drop lower to our S1 zone between 123.60 - 128.50. If price breaks below the S1 zone, it could drop further to our S2 & S3 zone. ...
Hey everyone, here's the analysis on DIS. Hit the LIKE button, follow us & leave a comment on ideas you would like to see next! Summary: Current price could drop from our R1 zone to our S1 zone, presenting us with a good opportunity to sell. Action: Sell Limit: 109.65 - 112.00 Stop Loss: 123.00 Take Profit: 96.40 Analysis: On the monthly chart, R1 zone...
Hey everyone, here's the analysis on PAGS. If you find this insightful, please follow and like our idea, also leave a comment on ideas you would like to see next! Summary: Current price could drop lower to zone 2 before a bounce, which presents a good opportunity to buy. Action: Buy Limit: 18.80 Stop Loss: 17.00 Take Profit: 25.30 Analysis: On the daily...
Hey everyone, here's my analysis on BTCUSD Summary Prices broke out of a key resistance turned support zone, in line with our trend line. We could be seeing a small pullback to re-test our support zone at 6880 before a strong bounce from here. Action: Buy Limit: 6880 Stop Loss: 6400 Take Profit: 7900 and 9200 Analysis: Price could be making a pullback to...
Hey everyone, here's the analysis on Tesla. Please give us a LIKE and leave a comment on ideas you would like to see next! Summary: As illustrated by the yellow dotted lines, price can rally higher to our R1 zone between 641.35 - 668.00 before dropping to our S1 zone between 502.00 - 524.00. Action: Sell Limit: 668.00 Stop Loss: 735.00 Take Profit:...
Hey everyone, here's my analysis on BTCUSD Summary: There was a breakout of the trend line and price is making a pullback to its previous breakout level where we could see a drop, as illustrated by the yellow dotted lines. Action: Sell Limit: 7120 Stop Loss: 7343 Take Profit: 6567 Analysis: On the D1 chart, price is facing a key resistance zone which it...
Hey everyone, here's the analysis on Wilmar, if you found this insightful, please like and leave a comment on ideas you would like to see next! Summary: As illustrated by the yellow dotted lines, I am expecting a drop in current price to zone 2 at the 3.22 area highlighted in green, before moving higher to our resistance zone between 3.73 - 3.81. Action: Buy...
Hey everyone, here's my analysis on SV3U: Summary: Price could drop to our S1 zone between 0.315 - 0.320 before going higher, as illustrated by the yellow dotted lines. Opportunity lies here; once price breaks above the R1 zone, which is a strong resistance area, it is likely to make a pullback to re-test the zone as a support zone before a strong bounce...


