There are multiple divergences on the GBPCHF 4h chart - and looking back at some divergences we've seen in the past couple of days, those divergences almost always indicated trend reversals. We even can spot a hidden divergence, since there are oscillators (RSI, CCI) with higher lows while price is showing lower lows. RSI has been in the oversold area, a couple...
There are multiple signals that indicate that WTICOUSD (West Texas Oil) will reverse the current trend. Price is still moving upwards but might soon change direction. All signals and indicators are related to daily candles. There is a strong divergence of price vs. the MACD histogram While price is going up, the Commodity Channel Index (CCI) is showing lower...
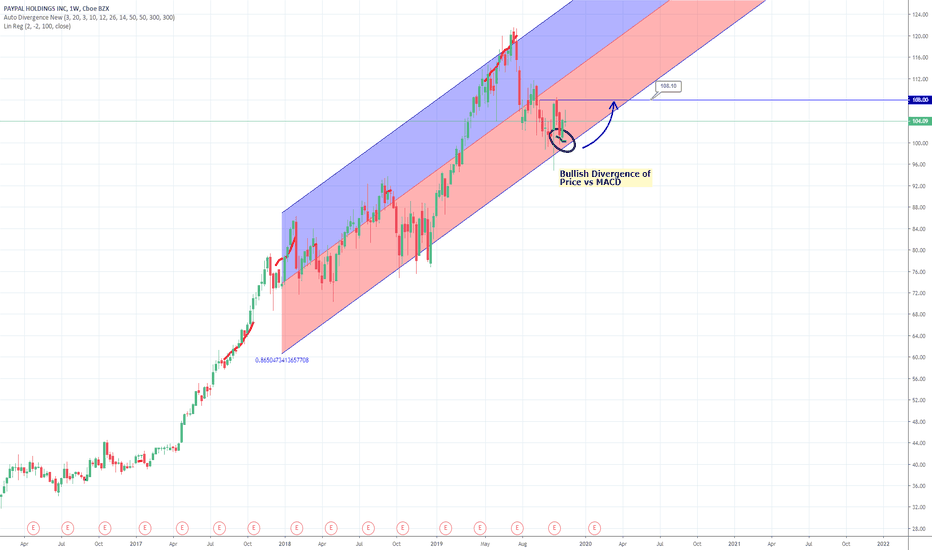
PYPL is currently moving on the lower-side of an upward-looking linear regression channel. There is a bullish divergence of price vs. MACD on the weekly chart - price might bounce of that lower boundary und go up at least to the resistance at 108.10
When you take the time to find correlations or market-dysfunctionalities, there are still a lot of profitable Opportunities out there in the Crypto-World. In this case, it looks like - based on backtesting results - if XRPUSD on Bitfinex is rising, while XRPUSD on Kraken is falling, the propablity is high, that price on Kraken will start to rise too. This is what...
AAPL is overbought and price is ranging above the EMA200 - pretty much the same situation as in May this year. This won't be a full trend reversal but maybe it's a pullback - price might touch the trendline and then start to climb again.
There have been a few trend reversals in the past couple weeks for NATGASUSD. These reversals occured right after Divergences of Price vs. Momentum. Currently, AutoDivergence signalled a bullish Divergence. In this case AutoDivergence also includes an RSI-filter to add an extra confirmation to this signal. Looks like a perfect time to enter a long position!...
There are several signs that indicate a huge Price-Jump for Ripple/BTC (XRPBTC). We see multiple Divergences on the weekly Chart. There are some bullish Divergences and a bearish one as well. These Divergences are based on MACD/ CCI vs. Price. In September 2018, right after a bullish Divergence , followed by a Trendline-Break and a MACD/ Signal-Line-Crossing...
Sometimes it is worth to check out other Timeframes than the ones you're used to. I usually check 1-hour, 4-hours and 1-day Candles - but of course technical indicators can be applied to all kind of Timeframes in-between. And sometimes you can see profitable Setups that are not obvious on the default ones. So why not check 45-minutes? Or 2.5-hours? Talking about...
Bitfinex:BTCUSD currently shows multiple Divergences on the 2hour Chart: a few hours ago, ... Momentum was rising while Price was falling the Commodity Channel Index (CCI) was rising while Price was falling These Divergences indicate that a Trend Reversal might happen soon. I assume that Price will start to rise - at least to the level of the weekly...
What a wild ride for SES - but now we see a bearish divergence of Price vs. CCI, so price might drop back to a much lower level. The daily pivot hasn't been touched yet - so this might be the level that price drops to.
Using AutoDivergence to identify Divergences on the AMZN 1D Chart shows that in this case Divergences of Price vs. CCI might indicate trend-reversals pretty accurate. There was a bullish Divergence that started at the end of September. Price started to rise on the first days of October an then went down a little-bit. This can be considered as pullback since the...
There is a bearish Divergence of Price vs CCI (Commodity Channel Index) on the ETHUSD 4H Chart! The Divergence was spotted with the help of the AutoDivergence Study . The AutoDivergence Study was set to generate a signal, when the smoothed price is still rising, while the (smoothed) CCI is already falling. Profit target is the level of the daily Pivot Point...
AutoDivergence shows a bullish Divergence of Price vs. Momentum on the DASH/USD 4H Chart- profit Target is 93.5
We do see a bearish divergence on the XBTUSD 1H chart (Kraken) at the end of this week. Looking at the daily chart the current green candle looks like a temporary peak but it still seems to be a downtrend. Going back to the 1H chart, we see that the bearish divergence is followed by two red candles - that might indicate the end of the uptrend. Profit target is the...
There are multiple divergences on the chart that seemed to have provided valid signals. A few hours ago there was a bullish divergence at the time when the price touched and bounced off the support-line. Price went up a few pips and probably is now in a pullback phase, so it might be a good opportunity to enter the trade. The profit target is at 1.236 - just below...
I've been playing around with the AutoDivergence Strategy on the 1H BTCUSD chart (Bitfinex) and tried some "unconventional" settings As with a lot of other Crypto-Pairs, trading only longs seems to perform much better than going long AND short. I configured AutoDivergence to use the MACD-histogram as an oscillator to find Divergences. I started to increase the...
Here are the settings that can be used to find divergences of MACD vs. Price on the 1H EURUSD chart: AutoDivergence Settings To automate this strategy you would need to apply the AutoDivergence Study to the chart - check that the properties are set to the same values as for the strategy. Luckily OANDA is supported by autoview, so you can automate the...
There's a bullish Divergence of Price vs. Momentum on the 1h AUDCAD chart. Price might go up to the resistance line at 0.90542


