Hey traders! Today we’re diving into a high-probability setup on the JPY/GBP pair with up to 22% upside on the monthly chart. I’ll cover the technicals, fundamentals, and exactly how to trade it. 📉 Chart pattern Looking at the chart, we’ve got a textbook falling channel stretching back from mid-2020. This descending structure has been consistent, but right...
Is gold safer than government bonds? The data suggests so. Since March 2020, long-term U.S. government bonds with maturities over 20 years have fallen close to 50% in value. Gold is up almost 100% over the same period. Do you think these trends will continue? I certainly do.
Is gold safer than government bonds? The data suggests so. Since March 2020, long-term European government bonds with maturities over 20 years have fallen 50% in value. Gold, as priced in Euros, is up over 100% over the same period. Do you think these trends will continue? I certainly do.
Gold has traded in an upward price channel since June 2024. This channel's upper and lower bands have acted as support and resistance several times, which reinforces their predictive value. The balance of probabilities suggests that gold could pull back either to the channel's midpoint, which coincides with its 50-day moving average, or to the lower bound of its...
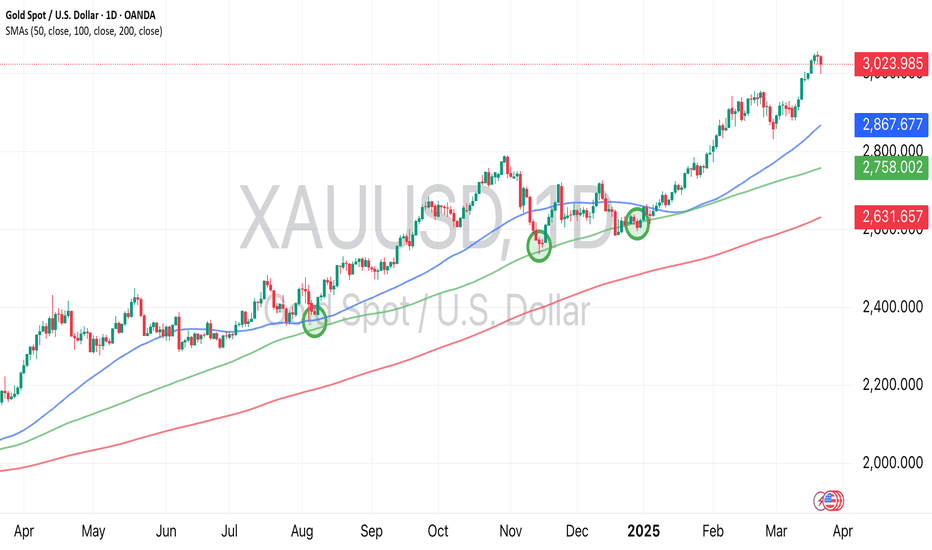
Historically, gold's 100-day moving average has been a good entry-point for traders and buy-and-hold investors. As you can see from the chart, it's provided support on multiple occasions. If gold is extended relative to its moving averages, you could wait for a pullback to go long. However, you might miss out on further upside, if the precious metal is in a...


