Dogecoin has been trading within a well-defined descending channel since early February respecting both trendline resistance and support Despite recent bullish momentum price action remains confined under a major trendline indicating the bearish structure is still intact Key Observations: Trend Price continues to form lower highs and lower lows within a downward...
Solana is showing signs of a potential bullish breakout after breaking out of the descending trendline and forming a clean structure Key Observations: Price broke out of the descending trendline with strong momentum. A potential inverse head and shoulders pattern has formed supporting the bullish outlook Currently trading around $123.90 price is facing minor...
Bitcoin is currently holding a strong bullish structure after bouncing from the key support zone around $81,200 – $81,800 The ascending trendline is being respected well and bulls are in control for now What to Watch A break above $84,705 could open the door for a rally toward $87,298 and possibly $88,500 Short-term pullback is possible into the $82,800 – $83,000...
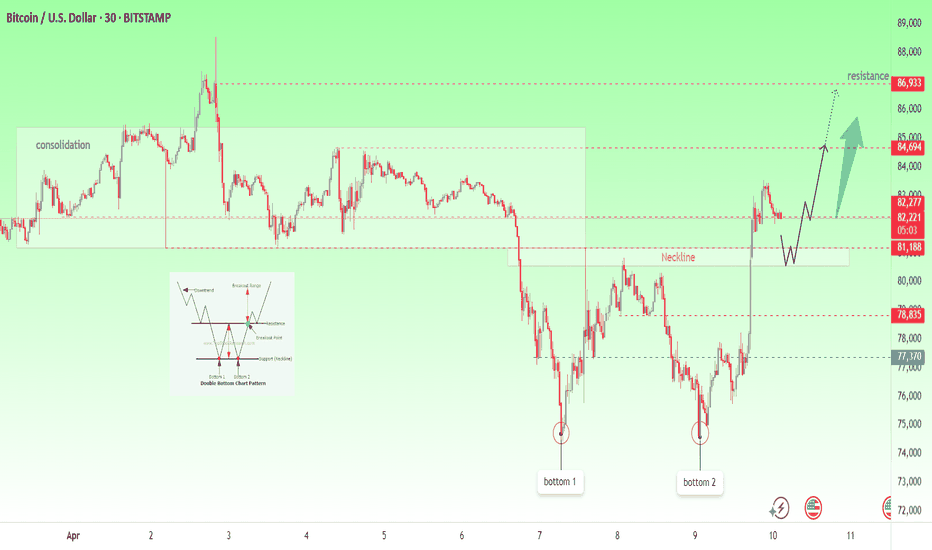
Bitcoin has printed a textbook double bottom pattern signaling a potential trend reversal after a sharp decline The market has now broken above the neckline and we may be witnessing the early stages of a bullish continuation Technical Breakdown: Pattern Identified: A clear double bottom has formed with Bottom 1 and Bottom 2 marked around the $73,500–$74,000 zone,...
Gold has seen a sharp bullish breakout from the falling wedge pattern (marked by the triangle) leading to an aggressive rally toward the 3211 zone We are now approaching a possible exhaustion point Price is currently sitting around 3211 where we could see a short-term pullback based on previous structure and momentum slowdown Key Support Levels 3167 3156 If...
GOLD (XAUUSD) – Key Zones & Short-Term Setup Gold has shown strong bullish momentum recently breakout of the descending trendline and pushing toward key resistance levels However the current price action is approaching a critical zone that traders should watch closely Resistance levels 3,130 3,148 Support levels 3,100 3,087 3,045 Price is testing this area...
After a significant breakdown from the rising channel structure WTI Crude Oil experienced an aggressive drop from the $73–$74 region leading to a change of character ( CHOCH ) and breaking through key trendline support This movement marked the end of the previous bullish structure and ushered in a sharp bearish impulse Key Observations: Bearish Divergence A clear...
Gold has recently broken out of a descending channel suggesting a potential shift in market sentiment This breakout coupled with a successful retest of the broken trendline could provide a strong bullish setup for the days ahead Key Levels to Watch Support Zone: 2950 – 2970 This area has held as a strong demand zone and marked the base for the recent rally ST...
Price remains in a clear downtrend within a descending channel. After a temporary consolidation it is now testing a key trendline resistance around the 3,017 zone Key Levels to Watch: Resistance/POI: 3,017 Breakout Zone: 2,970 (bearish confirmation if broken) Target: 2,910 (channel support zone) A potential lower high near resistance could trigger further...
Pair: EUR/USD Timeframe: 30-Minute The EUR/USD pair has just completed a classic technical move that started with a fake trendline breakdown followed by a strong bullish breakout This setup offers important insights for both bulls and bears. Technical Overview: Trendline Structure: Price had been respecting a rising trendline for several sessions until a brief...
GBPUSD Price Update – Bearish Momentum Alert The ascending channel has officially brokendown after a consolidation phase signaling a strong bearish bias Sellers are gaining control and there’s potential for a deeper move to the downside Key Resistance: 1.28200 | 1.28700 Key Support: 1.27000 | 1.25700 Risk Management Reminder: Always protect your capital—stick...


