Followers
4
Following
2
Ideas
4
Scripts
0
since Apr 28, 2017
chartpattern
indicator
trendanalysis
Less Tags
Show All Tags
All Types
Type
All Types
Indicators
Strategies
Libraries
All Accesses
Script access
All Accesses
Open
Protected
Invite-only
Public & Private
Privacy
Public & Private
Public
Private
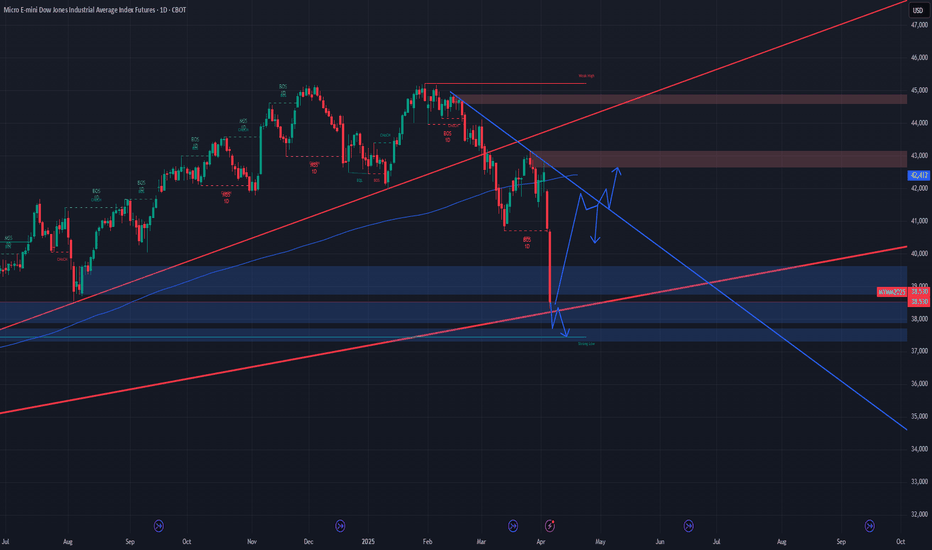
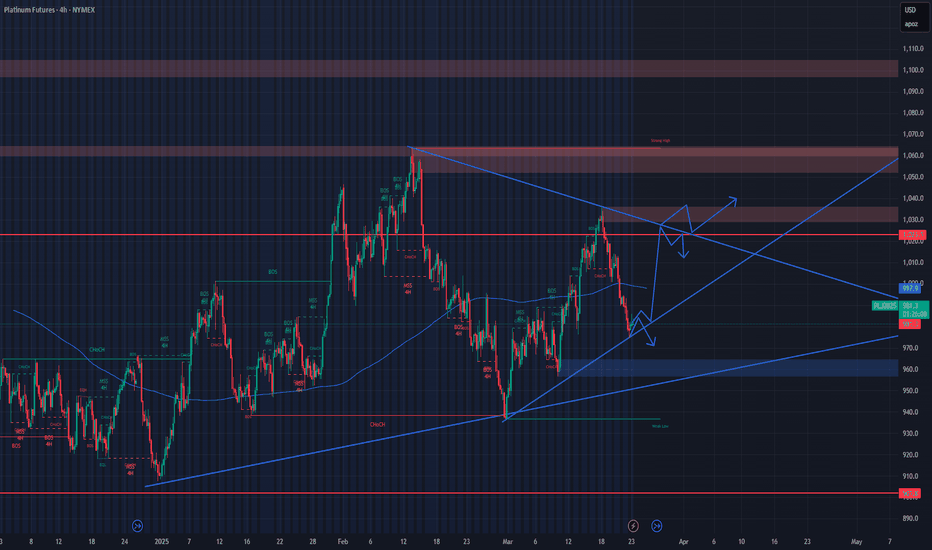
Arrows show possbile pattern candle can make Entry will be at the break and retest of trendline or wait to confirm bounce of the trendline.
1
Trend lines are marked up on daily and the weekly trendline is the lowest trendline the alerts are possible entries. buy low, sell high unless it breaks support or breaks the trend wait for retest of that support or trend line and buy or sell in that direction.
1
Alerts are my possible entries arrows are possible paths for breaks and trend bounces
3
Possible break of trend line or could bounce to downside set alerts for entry above trend Break and below the bounce
1
14
42
262
Message
Follow
Following
Unfollow
4
0
0
Message
Follow
Following
Unfollow
0
0
0
Message
Follow
Following
Unfollow
1
0
0
Message
Follow
Following
Unfollow
999
24
3614
Message
Follow
Following
Unfollow
1
0
0
Message
Follow
Following
Unfollow
Type
Script access
Privacy


