Triniboy_FX
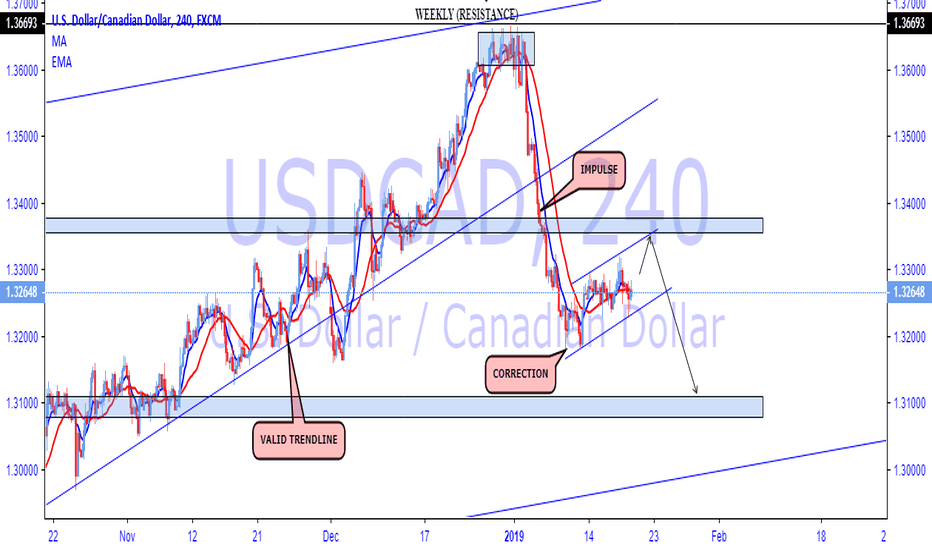
After price made an impulse obviously there must be a corrective channel before further downside. In this corrective channel we can see a 5th wave to b made where at resistance i will wait for a bearish confirmation to the downside. If however price action decides to break resistance this trade becomes invalid.
If price doesn't break trendline and continues to move up, only then does trade becomes invalid.
All points from the monthly to the lower timeframes has me looking to short this stock. risk to reward is nice also.n
Look for Gold to make a HL and buy low after confirmation. A bullish engulfing would be nice. Buying unto next resistance.
Price broke trendline after its rally down, wait for a pullback/retest and enter for a long
Higher timeframe its a correction after the impulse. but on the H1 we can get a channel from this correction. A break of this channel we can get a downwards movement to previous support. Enter after a bearish close breaking the channel or an retest of breakout.
Price Breakout, retest of support we can long up to next resistance if we get a double buttom or a bullish engulfing also will confirm the upward move.
Price made a new high breaking out of the trend. we can now see a retest of that trendline before we can take GU long.
Oil is been on the drop for some while. Since the break of the daily trendline price never retested. When we come down to the h4 timeframe we can see a bullish head and shoulders. Enjoy this commodity as we fatten our broker account with this trade idea.
So its been on the rise after that massive fall. IF we look on the daily timeframe price is making LH & LL as well as a bearish divergence. Down to the H4 time frame we can see 5 wave pattern. If we get a nice rejection off that trendline of the 78.6% fib zone we can be looking at a nice fall with the completion of an ABC correction.
Price bounced off daily support made a new high and higher low. we can now see price action make unto a higher low, swing low to high it will land beautifully at that support which puts us at a 61.8% fib level. the buy set up would be the initial move i'm going for.
A nice break of the trendline we can see now we at a bearish correction. Sell high and enjoy all the way down.
Perfect 3 level rise, all timeframes from top down analysis shows this pair about to drop. right now its in consolidation, overall on this pair i like the sell on it.
On this pair the daily into the lower timeframes we can clearly see LH formations. Also I like how we can clearly see a descending triangle formation. How i would trade this i would look for a rejection of support, retest and enter long to the 61.8% my first target.
Its easy to see a perfect wave formation on this pair. Now we can see the correction of ABC. A nice swing trade to look at in time to come for a sell longterm.


