UnbieY
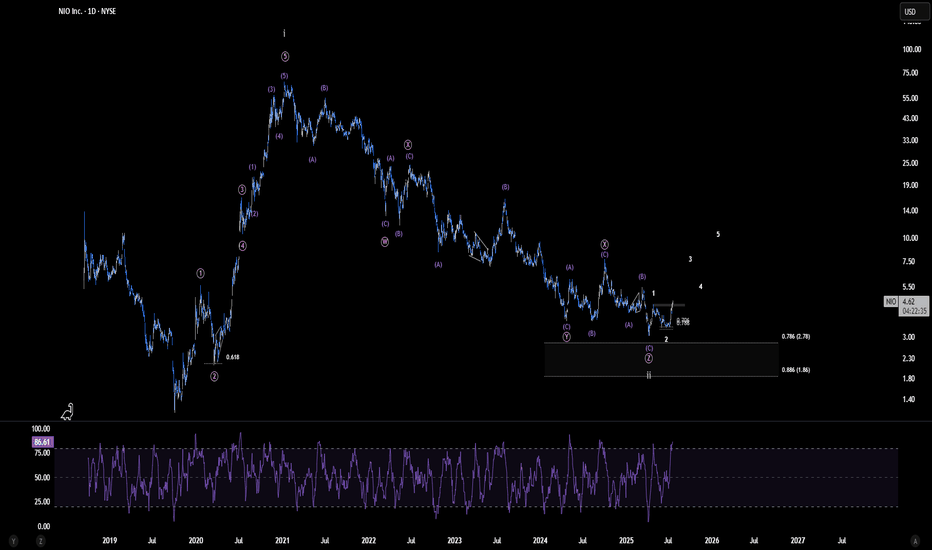
EssentialPersonally, I see only two realistic scenarios for NIO: either the major correction has already concluded, or we are very close to its completion. The scenario presented here appears the most compelling, as it allows for the possibility of a significant bullish impulse beginning to unfold toward the end of Q4 2025—potentially fueled by improved profitability...
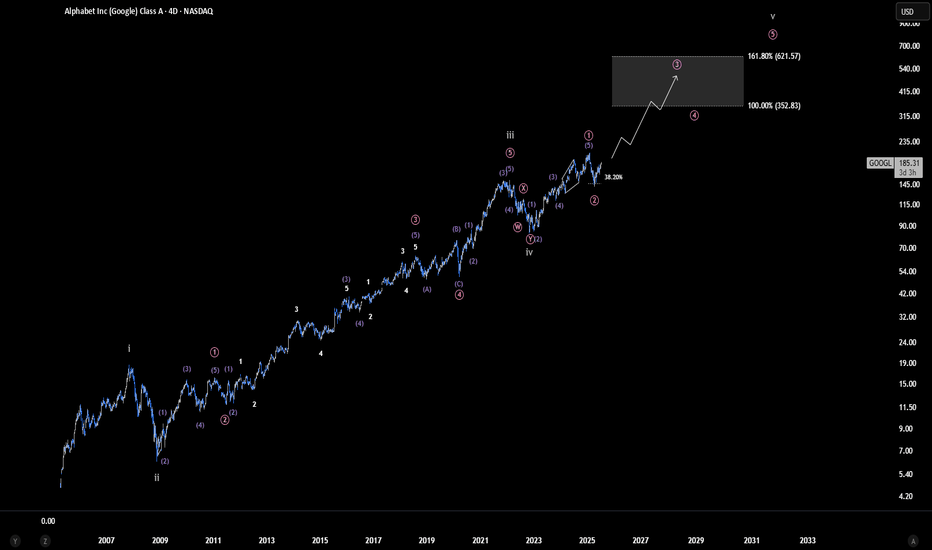
We appear to be in the final wave of a major bull run that began all the way back in 2005. If this count unfolds as expected, Google could potentially rally toward the $350–$620 range or even higher representing a gain of over 200% from current levels. This would mark the completion of the fifth and final wave before a major long-term correction sets in. That...
Litecoin may be on the verge of a breakout following nearly four years of accumulation. From a technical standpoint, this could lead to a powerful rally toward targets in the $600–$1000 range. However, the timing of this Wave 4 consolidation don’t align particularly well with a typical, healthy correction. A break below the red line would invalidate the current...
My primary view is that we’re in the final stages of an ending diagonal, which could lift the price to new all-time highs, potentially between $460 and $650. Wave 4 of this structure appears to have completed after precisely tagging key Fibonacci support, and since then, we've already seen a strong bounce from that low. I’m now watching for the development of the...
This is the current outlook for ICP. I anticipate a significant impulse to the upside, with technical projections suggesting a potential move toward the $30 to $100 range, representing gains of over 700%. However, as is often the case with altcoins, caution is warranted as any break to a new low would invalidate this scenario. As long as the low holds, the focus...
As illustrated, we appear to be in the final wave to the upside. At this stage, I’m treating Wave 5 as a standard impulse. However, given that Wave 4 retraced deeply, nearly to the termination point of Wave 1, there remains a modest possibility that this higher-degree Wave 5 in gray, which began in 2020, could ultimately unfold as an ending diagonal. That said,...
This is my lower timeframe analysis. Price has now reached the ideal target area for Wave 3, suggesting that a corrective phase may soon follow. This potential retracement could also align with broader market reactions to a possible announcement from Trump regarding new tariffs on Russia this coming Monday. P.S. The macro count and higher timeframe outlook will...
From an Elliott Wave standpoint, the structure appears highly promising. The current formation allows for two plausible interpretations: either the early stages of a strong impulsive wave, or a more measured diagonal unfolding at the cycle degree. A break below the red level would decisively invalidate this count
HSI:HSI This is the most bearish scenario I’m considering for the Hang Seng Index, though it is not my preferred outlook. For this idea to play out, we would still need to see a substantial downward correction in the form of a zigzag. While such a move is technically possible, it seems unlikely given that the index has already been in a corrective phase for...
This is the main idea for SBLK. I’m confident we’re in the early stages of a major impulsive move to the upside. Taking both financial and Elliott Wave perspectives into account, this scenario fits the overall context the best. I expect the price to break above the 2022 high in the near future. The red line marks a clear invalidation point for this outlook.
#SOL This is my preferred and most bullish scenario for Solana. We're currently in a higher-degree Wave 2 correction following a completed Wave 1. The micro count remains unclear for now, further price action should bring more clarity. It’s possible the X-wave has already completed, suggesting additional downside ahead. The only problem I see with this scenario...
In this scenario, I’m interpreting the larger Wave 1 as a potential leading contracting diagonal, where each subwave is unfolding as a zigzag (3-3-3-3-3) rather than the typical 5-3-5-3-5 structure.Currently, we appear to be in Wave 4 (Pink) of this diagonal, which seems to be in the final stages of its downward leg before starting Wave 5 the final move of the...
The bigger picture remains unchanged. As mentioned in the previous count, the Orange Wave 1/2 has either completed or is very close to completion. I can now say with confidence that we're approaching the end of Wave 2, which appears to be unfolding as an ABC correction within that second wave. Disclaimer: This analysis is for informational and educational...
Here's one of my 2 micro timeframe counts for XRP. As you can see, Wave 2 (Pink) has already reacted nicely to the 0.618 Fibonacci level,(the golden ratio), and it looks like we're currently forming a lower-degree Wave 1/2 before potentially launching into an impulsive Wave 3. That said, the recent move up from the Wave 2 (Pink) low looks quite corrective, which...
I have two possible short-term scenarios for Rheinmetall. Both share the same structure on the higher degrees, but they differ slightly in the short term. Despite the difference in micro-counts, both scenarios remain bullish in the near term. As shown here, in this scenario, Wave 5 (yellow) is unfolding as an ending expanding diagonal, with each subwave in orange...
As current price action unfolds, a Wave 5 (gray) forming as an ending diagonal appears to be the most likely scenario. However, the micro count remains open to interpretation and may differ slightly. Continued observation should eventually provide clarity and confirmation at the lower degrees.This ending diagonal seems to be approaching completion. A sudden...
This is my bullish Elliott Wave count for Aedifica, which I consider the more probable scenario. The corrective structure that began in early February 2020 reached the ideal Fibonacci retracement levels for a sharp correction between 0.5 and 0.618 by October 26, 2023 (not shown in this chart), and has already unfolded over nearly four years. Despite the fact that...
The price reacted to the 0.236–0.272 Fibonacci level, effectively marking the end of the WXYXZ correction. However, for a Wave 2, this represents a relatively shallow retracement implying that alternative scenarios must remain on the table. This could still be an unfolding flat structure (3-3-5), with Wave A forming as a triple zigzag though this is less likely. A...


