UncannyDeduction
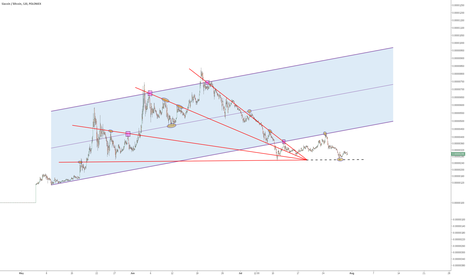
There are incredible patterns in the Litecoin chart, they are practically everywhere. The chart contains the most simplistic presentation of them. Please pan around in the chart and enjoy the pattern. Blue line is the resistance it's trying to push through...
Bitcoin is trying to break into the upper blue trend channel. I believe it will succeed and head for $6000 within a month or so, ending up in the middle of the blue trend channel and then possibly going down.
Don't be scared of the upcoming resistance (the red line). A small downturn movement is to be expected. Do not fear.
Some trend channels. No analysis. (moved the red trendchannel a fraction from its position in the linked chart, for the current ratio not to break into the channel)
$250 within a month seems reasonable, since Litecoin and Bitcoin seem to regain their health.
Let's see if this happens. Way to early to say...
I think gold will return to the upward trend channel before 1st September. That means $1440 gold.
I'm extremely optimistic about Bitcoin! Both short and long term! Buy Buy Buy.... (I'm buying litecoin)
The heart beat is almost gone. Someone call the ambulance. Wait, its too late. The patient is already dead.
If Ethereum goes above $250 it should pretty easily go to $650 . I'm still waiting for a crash to buy at a cheaper price though (the lower trend channel). Because I think Bitcoin is about to crash. This could pull ethereum downwards.
Really simple cup n' handle finishing off in 2019...
A bull trend is hiding.
A new symmetry I found...
Is a bear trend channel evolving?
Here's the trendlines - you judge for yourself...
Combining some of my charts... 1: st august pops up!
I have no idea what Siacoin is but the trend channel is beautiful.


