UnknownUnicorn1149804
Ascending triangle forming on 6 hrs chart.... will see where it goes on the next days... good luck . Triangulo Ascendente en grafico de 6 hrs, veremos que pasa en los proximos dias, buena suerte.
Cup and handle forming , whatch close, indicators bullish as hell , 2hr chart.... Taza formandose , hay que estar atentos , los indicadores estan alcistas , grafico de dos horas.
Expecting breakout of ascending triangle, and after that looking to break past high marked with red horizontal line, RSI and Stoch/RSI on Bullish zone, Squeeze momentum indicator showing bullish. Esperando romper triangulo ascendente y buscar confirmar ondas Elliot, Indicadores mostrando señal alcista hasta ahora.... hay q esperar próximos dias.
SItting on a strong mayor support , demand zone bearkout,Stochastic/rsi and rsi on bullish zone, Squeeze momentum indicator neutral, waiting to hit some green bars, 2 posible scenarios for me marked by the blue arrows. Estamos sobre fuerte zona de demanda, así como soporte mayor, preveo que subamos a poner a prueba resistencia marcada como zona roja de oferta, el...
Need to break those 2 red areas of resistance, fibonacci level 0.618 is a support, expecting to break those zones helped by the news . Necesitamos romper esas dos zonas rojas de resistencia, estamos sobre fibonacci 0.618 que sirve como soporte, esperemos romper esas zonas rojas con las noticas de stratis.
Looks like it found support on red area, looking to form Elliot Waves impulse 5, Indicators not showing good signs though, gotta wait for this next candles to show direction. Parece que encontramos soporte en el área roja, buscamos formar el impulso 5 de las ondas Elliot , los indicadores no muestran señales positivas , sin embargo tenemos que esperar un par de...
Image speaks for itself, good luck. La imagen habla por si sola.
Sitting on fibonnacci level 0.236 , looking to break out of the ichimoku cloud, holding pretty good last few days, looking to form a cup kind of shape and fly.... Sobre Nivel Fibonacci 0.236 , buscamos romper fuera de nube ichimoku, se ha mantenido por encima de soporte mayor y fibonacci los ultimos dias, siempre busco esas pequeñas formas de taza que forma para...
Strong sell zone ahead, looking to bounce a bit and then go stronger and break it, next days will tell, currently on minor support, above ichimoku cloud, waiting for a cross of the conversion line to the base line of ichimoku, looking good, lets hit all time highs soon. Fuerte Zona de venta se aproxima, tal vez corrija un poco y volvamos a ponerla a prueba, nos...
SItting on support trendline, looking oversold on Stochastic/RSI waiting for confirmation to go up, EMAs looking good, looking at this posible eliott waves formation. ANy advice welcome,
EMAs not showing anything good, RSI bearish. hopefully we go down to support and go back up to restest fibonacci level.
LBC EMAs looking lateral, STOCH/RSI looking bearish, looking to break resistance down trendlines, hopefully some good news will take us there.... not looking very optimistics ATM.
EMAs looking for a crossing, STOCH/RSI looking to head to oversold zone, hopefully we stay on support level of fibonacci and trendline , seems like its forming a cup and handle.
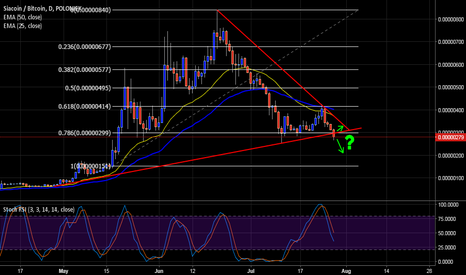
Looking to stay above support trendline , if not we can go down to restest fibonacci level, EMAS showing down movement, also Stochastic/RSI.
I think we are going down to touch support and then back up to retest resistance at level fibonacci. Stochastic/RSI looking bearish. EMAs 25/50 acting as resistances. Any advice welcome.
Looks like it is going for 2300-2360 price and then bounce back to 1800 range. any advice welcome
This idea looks better, going for 2200 range and go back to restest support, following trend channel.
Cup and handle, support bullinsh trendline restest, looking good.


