UnknownUnicorn3717994
CADJPY Bearish Bat Pattern and Short Opportunity Description: CADJPY completed a Bearish Alt Bat PAttern on the H4 Chart. Bearish correction is predicted. OSMA divergence confirms the bearish reversal Trade Setup TRADE: Short Trade Period:Intraday / Midterm Estimated completion time: 2-8 H4 Candle Stick The trend in the Timeframe: Bullish The trend in the...
EURUSD price action have been trading in a quite narrow range, price has almost reached the prior lows where I see convergence developing. Looking 1.1176 a good area to build long positions with a 50 pips stop, targeting 1.1338 area. t.me/traderfromhell (CHANNEL)
Gold Prices Decline as China Manufacturing Data Lifts Confidence China's Caixin/Markit Manufacturing Purchasing Managers' Index (PMI) rose to 50.8 from 49.9 in February. That was the strongest reading in eight months and followed an uptick in the official PMI, which tracks mainly state-owned enterprises. The data suggested China's ailing manufacturing sector is...
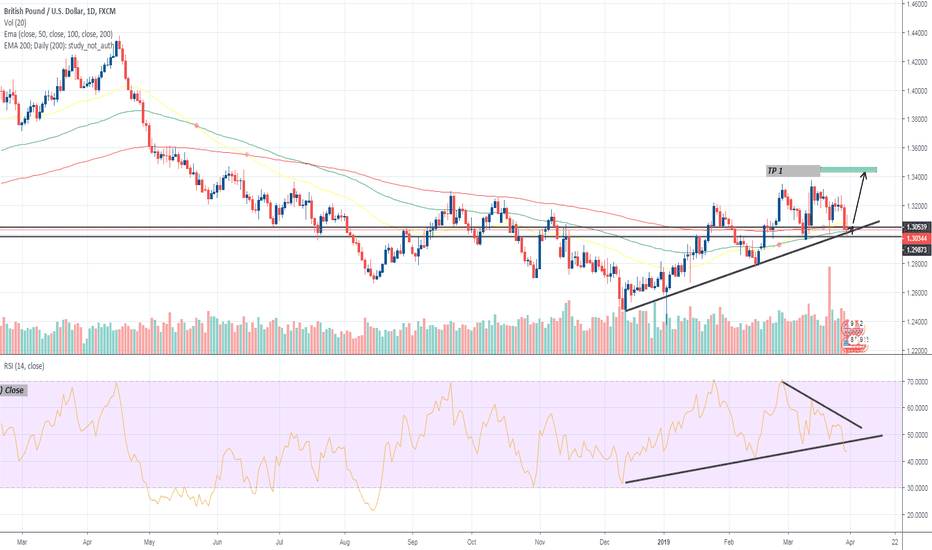
The broader outlook for GBP/USD is no longer bullish as both price and the Relative Strength Index (RSI) threaten the upwards trends from late last year, and the advance from the 2019-low (1.2373) may continue to unravel following the string of failed attempts to close above the Fibonacci overlap around 1.3310 (100% expansion) to 1.3370 (78.6% expansion). Recent...
The British pound had a very sensitive downward breeding. But as you can see in the table Pound could not keep the seller under the price of 1.29 - 1.28 and continued its positive rise by creating a scalp ... Now the buyers have a very high share in this fall in prices
The daily chart is looking to have a positive improvement, supported by tweezer bottoms also IMO. FYI: This pair closed above 1.3100 on the hourly chart already, and now this opens 1.3200 again. Buckel up and manage your Vote Brexit Parlament: www.theguardian.com
Elliot Waves Target Buy Short Term 1.324
TVC:DXY DOLLAR TO CONTINUE TO TRADE HIGHER IN DAYS AHEAD The US Dollar index (DXY) reversed last week after hitting confluent support by way of a trend-line and the 200-day MA. The underside trend-line remains a line of significant interest as it holds together the bottom of a developing ascending wedge. The wedge may take a couple of months or longer to fully...
Back to daily pivot @ 1.13216 and most probably (H+L)/2 of H4 mother bar @ 1.13398 has to be touched. days range. 1.1332 1.1257 NOTES: My strategy is Buy low & Sell High ...
The EUR/USD jumped from 1.1355 to 1.1447, reaching the strongest level since February 4. Afterward pulled back modestly and near the end of the session was hovering around 1.1440, up 80 pips for the day, having the best performance since January. But what is this on chart ... is a Recovery #EurUsd
GBPUSD now looks like a wedge at the resistance IMHO a powerful buy-back is seen and a check out of the bulls ... Theresa May survives Brex and we are already expecting a new era in GBP
We have about 1 week to follow AUDUSD for a supreme rise but in fact it is going down every day. But I still tell you not to worry and not to close your order because soon buyers will take control of us 0.73 and this would be a good step in mind and RBA would be a great help if the GDP was on the Aussie side but do not forget that News, politics and USD movement...
we see a fairly large increase in GBPUSD which is very strong and weakened by the dollar and this gives us a fairly high share. I have placed 3 profits that can be hit within a 1 week time frame but I actually have 6 profits named TP1 1.2740 TP2 1.2840 TP3 1.2940 TP4 1.3040 TP5 1.3140 TP6 1.3240
we see a fracture of the 3 GU supports and I believe now and for a great risk that will give the may in its speech at 4GMT and expect a target at 1.22
I look at a triangle triangle in EURUSD where I do not know how to handle it ... but the best way to see a pullback at 1.138 and then 1.144 to continue its target
For those who are selling EURUSD, I do not know if they know much about the wave and scenario that I have built, but there is a market opening that can have a drop and a bearish control that can be too dark and an entry the longest of bulls EURUSD (Support) S3 1.1388 S2 1.1397 S1 1.1404 (Resistance) R3 1.1420 R2 1.1429 R1 1.1436
but the biggest problem is how the gaps will be opened today and I hope for an opening in 0.729 for pushing buyers to advance in the opposite direction if 0.7000 and 0.6970 breaks down it is very likely sellers will push for 0.6800. However going below 0.7 will be extremely difficult as Aussie is finding a lot of support at 0.7190-0.7200. So below 0.7190 I would...
Well, she tried again with a bullish candle, but failed to keep the price at the new 3500 resistance level, turned down and now is looking more bearish. For me, the targets are still the same split earlier this may fall down to $ 3000-2455 This is seriously a pain for most dealers because they did not expect this price drop. All were very bullish a few days...


