UnknownUnicorn924366
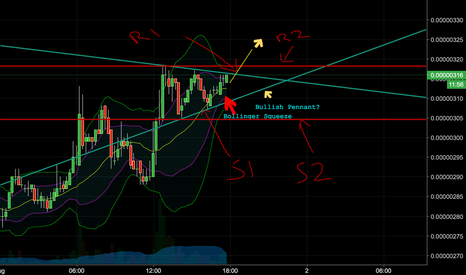
Set a stop - loss below support. If it breaks resistance I see the 3 following targets as shown on the chart. Primary target is based upon multiple Fibonacci alignments at that price level.
If price breaks resistance look for a move up towards the fib extention of 1 or 1.272. Bullish on the 4 hour chart and possibly looking at a third wave in the elliot wave pattern. Also can see hidden bullish divergence on the chart.
We may be seeing what is potentially an elliot wave ABCDE correctional pattern. Look for the price to bounce off of the support line off the triangle (which would be E of the correctional pattern). If it bounces you may look to enter just above the support line and look to sell just previous to the resistance line of the triangle. If the price cleanly breaks...
1 day MACD cross. RSI just moving upwards in the oversold zone. Price bouncing off a major resistance line. Place stop-loss below major support line. **** My apologies for republishing. I am having difficulty getting the full MACD indicator to be viewable. It can adjusted manually for the viewer to see it.
Looks like wave c is forming for the elliot wave correction pattern. Target ~.008
Wave 2 bounced perfectly off of the .618 line. Fib extension of 1-2 bounced off of the 1.272 line. Look either for a further drop to the .618 fib line and a bounce above the resistance line the the target price around fib retracement levels 1 or 1.272. Also look at where the price currently sits at .382. If it bounces, it could be the beginning of wave 5. In...
Elliot Wave 1 looks to have completed, if the price slightly dips to the .618 fib retracement of wave 1 then I am looking at the target of wave 3 around fib extension 1 - 1.272 of waves 1-2 . However this COULD be a reversal if we see the price dip below the .618 level. Be careful.
Just a simplification of my first chart.
Although the price has already made a steep decline, I thought this was a great opportunity to take a look at this ominous warning signal. The price made two consecutive high highs, yet the RSI and Stochastic oscillator both made two obvious lower highs at the same points. This is a perfect example of the power of divergences, in this case bearish divergence.
I corrected the trend line reflecting recent price movement. The ABC correction wave is a flat formation wave.
Wave 3 continuation. Watch support line closely.
If it breaks the support line next support ~ 2542


