There is a high chance that CADJPY will retraced from the underlined blue resistance. I see strong bearish confirmation on an hourly time frame: a formation of a bearish imbalance and a change of character. I expect a bearish move to 105.05 ❤️Please, support my work with like, thank you!❤️ I am part of Trade Nation's Influencer program and receive a...
I see a confirmed bullish reversal on Dollar Index initiated after a test of a key daily horizontal support. A formation of a double bottom pattern on that and a consequent violation of its neckline provides a strong bullish signal. I think that the index will reach at least 105.0 level soon. ❤️Please, support my work with like, thank you!❤️
There is a high chance that AUDCAD will retrace from the intraday resistance. A bearish movement after an extended consolidation on an hourly time frame provides a reliable bearish signal. I expect a down movement at least to 0.901 ❤️Please, support my work with like, thank you!❤️ I am part of Trade Nation's Influencer program and receive a monthly fee...
One of the setups that we discussed on a today's live stream was a bullish flag pattern on WTI Crude Oil on an hourly chart. Its resistance breakout provides a strong bullish confirmation. We can expect growth at least to 70 level. ❤️Please, support my work with like, thank you!❤️
There is a high chance that GBPJPY will retrace from the underlined resistance zone. A formation of a bearish engulfing candle indicates a strong bearish pressure. With a high probability, the price will drop to 194.0 level. ❤️Please, support my work with like, thank you!❤️ I am part of Trade Nation's Influencer program and receive a monthly fee for...
It looks like Solana is ready to return to a bullish trend. We see multiple strong price action confirmations after a test of a significant daily support. The price formed the ascending triangle on that, and violated both its neckline and a resistance line of a falling wedge pattern. Looks like the market can reach 180 level easily soon. ❤️Please, support...
I see a test of a significant supply zone on AUDCAD. It is based on a recently broken horizontal support cluster and a rising trend line. I believe that the selling orders will accumulate within that area. Chances will be high that the price will drop from that at least to 0.898 support. ❤️Please, support my work with like, thank you!❤️ I am part of Trade...
Dollar Index is currently consolidating within a range on intraday time frames. Testing its upper boundary, the market formed a double top pattern. With a strong bearish mood after the opening, the market is going to drop lower. Goal - 103.8 ❤️Please, support my work with like, thank you!❤️
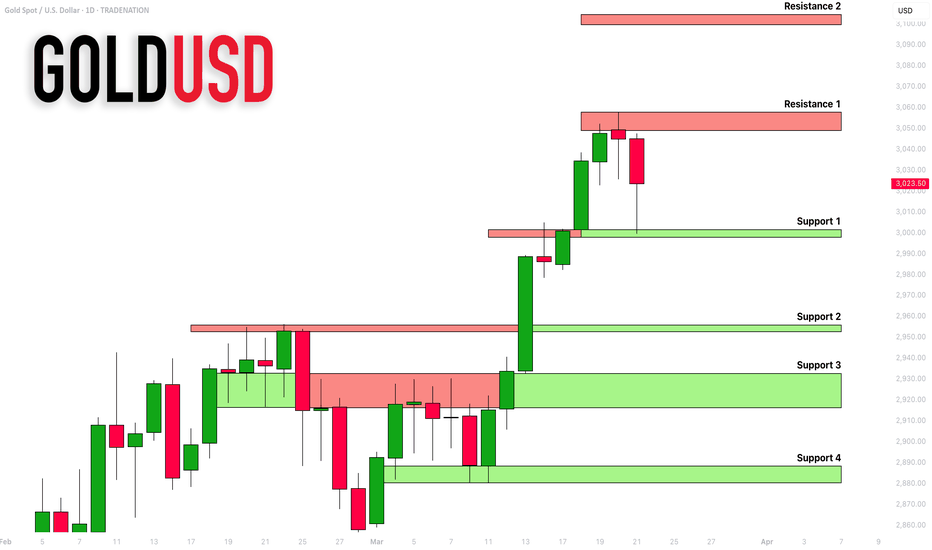
Here is my latest support & resistance analysis for Gold for next week. Consider these structures for pullback/breakout trading. ❤️Please, support my work with like, thank you!❤️ I am part of Trade Nation's Influencer program and receive a monthly fee for using their TradingView charts in my analysis.
Here is my latest structure analysis for EURUSD; Resistance 1: 1.0944 - 1.0955 area Support 1: 1.0804 - 1.0834 area Support 2: 1.0598 - 1.0630 area Support 3: 1.0515 - 1.0533 area Support 4: 1.0359 - 1.0377 area Support 5: 1.0727 - 1.0290 area Support 6: 1.0717 - 1.0240 area Consider these structures for pullback/breakout trading. ❤️Please, support my work...
USDCHF looks bullish after a test of the underlined blue support. The price formed a double bottom on that and broke its neckline on Friday. We see a positive bullish reaction to that after its retest. I think that the market will continue rising and reach at least 0.885 resistance. ❤️Please, support my work with like, thank you!❤️ I am part of Trade...
In my daily posts, I quite frequently use multiple time frame analysis. If you want to enhance your predictions and make more accurate decisions, this is the technique you need to master. In the today's post, we will discuss the crucial importance of multiple time frames analysis in trading the financial markets and forex gold in particular. 1️⃣...
The head & shoulders pattern that I spotted earlier perfectly played out and we saw a strong bearish move after the NY session opening. HOWEVER, be extremely careful. Many traders started to sell heavily, anticipating an extended bearish reversal. For now the price nicely respected 3000 psychological support that previously was a resistance. I suggest not...
CADCHF formed the insidebar pattern after a test of a strong resistance cluster. Bearish breakout of its range is a strong intraday bearish signal. I expect a retracement from the underlined area at least to 0.514 level. ❤️Please, support my work with like, thank you!❤️ I am part of Trade Nation's Influencer program and receive a monthly fee for using...
There is a high chance that NZDUSD will continue growing today. The price formed a cup & handle pattern on a key daily support. We can expect a bullish movement at least to 0.5774 resistance. ❤️Please, support my work with like, thank you!❤️
I see a nice opportunity to buy NZDJPY after a test of a key daily support. As a confirmation, I spotted the insidebar pattern with a breakout of the upper boundary of its range. I expect a bullish movement at least to 85.75 ❤️Please, support my work with like, thank you!❤️ I am part of Trade Nation's Influencer program and receive a monthly fee for using...
Here are the updates & outlook for multiple instruments in my watch list. 1️⃣ #GOLD XAUUSD 1H time frame 🥇 Earlier on Sunday, I shared a completed head & shoulders pattern on Gold. Its neckline was respected and the price bounced from that, setting a new historic high. That same neckline is now a perfect base for a new head & shoulders pattern. The plan...
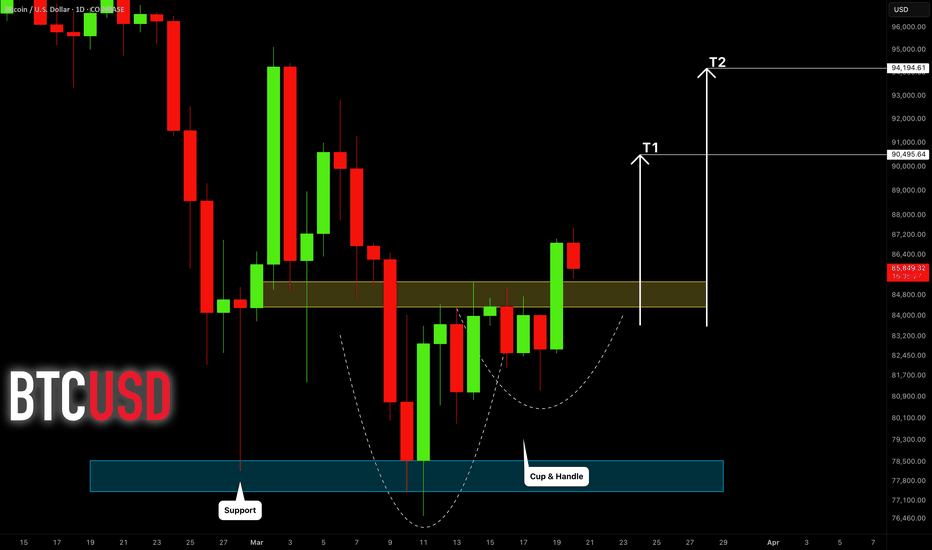
Bitcoin turned bullish after the yesterday's FOMC. The price broke and closed above a significant daily resistance. I see a confirmed bullish reversal pattern now: a cup & handle with a broken horizontal neckline. I think that the market will continue growing and reach at least 90500 level soon. ❤️Please, support my work with like, thank you!❤️


