#BTC/USDT #Analysis Description --------------------------------------------------------------- + Bitcoin has successfully broken out from the resistance, this is the third time bitcoin has broken out from the resistance line, in the previous two breakouts bitcoin had significant growth and we can expect similar growth this time. + the next target for bitcoin is...
--------------------------------------------------------------- Description --------------------------------------------------------------- + Perfect falling wedge pattern has formed for ARB, a clear breakout from this falling wedge pattern is imminent. + breakout from this falling wedge pattern could push the price to previous All time high....
Description --------------------------------------------------------------- + ICP has started reversal inside the channel and the price is heading towards the resistance zone, this gives a bullish trade opportunity. --------------------------------------------------------------- VectorAlgo Trade Details ------------------------------ Entry Price: 5.3 Stop...
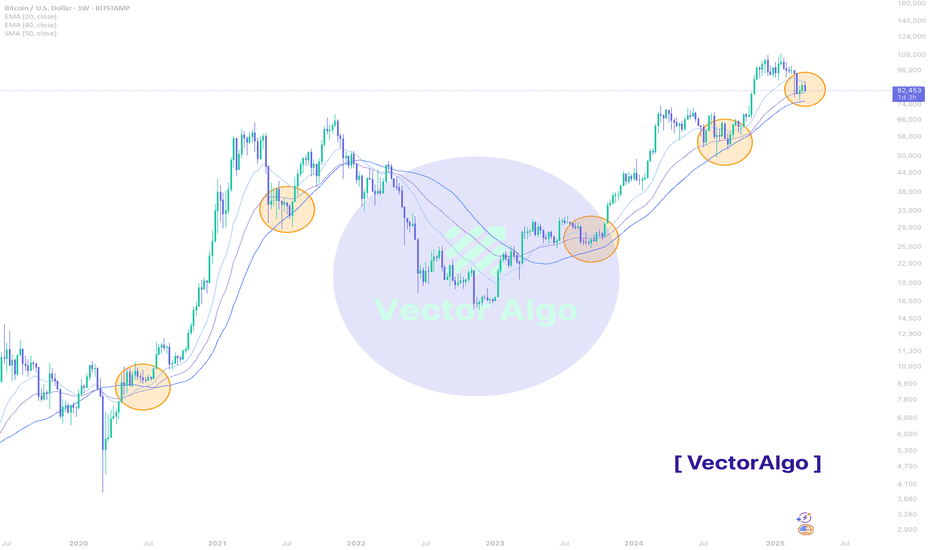
#BTC/USD #Analysis Description --------------------------------------------------------------- BTC/USD – Weekly Chart Analysis 📉 Current Price: $82,239 (-4.47%) 📈 Key Moving Averages: 🔹 EMA 20: 88,143 🔹 EMA 40: 81,116 🔹 SMA 50: 76,230 EMA Support Holds Strong – The chart highlights multiple historical instances where BTC found support at the 20-40 EMA zone...
#BNB/USDT #Analysis Description --------------------------------------------------------------- 📉 Pair: BNB/USDT (Binance, 1W Chart) 📊 Analysis by: VectorAlgo Binance Coin (BNB) has been trading within a well-defined ascending channel, showing strong bullish momentum since mid-2023. The price is currently near the mid-range of the channel and is attempting to...
#SOL/USDT #Analysis Description --------------------------------------------------------------- Solana (SOL) has been in a strong uptrend since late 2023, but recent price action suggests a key test of support around the $115–$135 zone. This level was previously a major resistance and is now being retested as support. Moving Averages: The price has dipped below...
#DXY #Analysis Description --------------------------------------------------------------- + The Dollar Index has breached its support level and is now trading below it, moving toward the next support zone around $100. + This development is positive for Bitcoin and the broader cryptocurrency market, as the US Dollar Index typically declines during a bull run. ...
#BTC #Analysis Description --------------------------------------------------------------- + Bitcoin has successfully tested the 200 EMA line and rebounded effectively. + However, caution is still advised, as the price may revisit the EMA support line. + The strong performance of the EMA is a positive indicator, suggesting the bullish trend could persist...
#ETH #Analysis Description --------------------------------------------------------------- + ETH has two pending CME future gaps to filled. + First gap is around 2900-3400 range and second gap is around 2500-2600 range. + Sooner or later these CME gaps will get filled. I'm expecting Gap2 get filled in this or next month and Gap 1 in the second or third quarter....
#CRUDE #Analysis Description --------------------------------------------------------------- + Crude has formed a nice descending triangle pattern and price has broken down the support line which formed over the years. + A clear breakdown from this support would push down the prices further. + Next target is 50-40$ range....
#BTC/USD #Analysis Description --------------------------------------------------------------- + Dec 2024 Bitcoin chart looks exactly like the pattern of the Dec-2023 + In Dec-2023 we saw similar channel formation and price broke down from the support line briefly and then bounce back in January. + The same pattern we are seeing now, channel formation completed...
#VANA/USDT #Analysis Description --------------------------------------------------------------- + VANA has successfully broken out from the resistance zone + We see strong bullish candles with decent volumes. I'm expecting this bullish momentum to hold. + I see a good trade opportunity here, i'm entering a small position here. Entry: 22.2 SL: 18.2 TPs: 24,...
#ETH/BTC #Analysis Description --------------------------------------------------------------- + ETH/BTC pattern looks exactly like the pattern we have seen before 2021 bull run. + There is some serious is consolidation that we have seen over the years and price is expecting to be bounced back any time now. + I'm expecting the price to move in a pattern which...
#BTC/USDT #Analysis Description --------------------------------------------------------------- + Currently bitcoin is trading around its support zone of 95K and this is weak support which held and broke multiple times. + Strong resistance for bitcoin is around 92K, if bitcoin falls to this level, we can expect the support to hold. + I'm expecting a drop in...
#BTC/USDT #Analysis Description --------------------------------------------------------------- + Bitcoin is currently trading inside the channel and price is around the support zone + Price touched support zone multiple times and this is the third touch of the resistance + I'm expecting the price to bounce back from this support zone. + If the price fails to...
#KDA/USDT #Analysis Description --------------------------------------------------------------- + KDA has experienced a significant downtrend, with the price hitting rock bottom. + It's seen a 98% correction from its previous all-time high (ATH). + We're now observing a slight bounce back from the support zone, indicating a potential reversal in the trend. This...
#BTC.D (Bitcoin Dominance) #Analysis Description --------------------------------------------------------------- + Bitcoin dominance has formed a nice falling wedge pattern and support is broken successfully. + This was the moment that everyone was waiting for, in 2025 we are gonna see a huge bull run, greater than last bull run. + Falling wedge is a bearish...
#Altcoin Marketcap #Analysis Description --------------------------------------------------------------- + Comparing the altcoin marketcap on 2020 vs 2024 Christmas (pre bull run years), during the christmas week altcoin had a significant drop in the marketcap and after holidays we saw significant growth in the marketcap pushing the altcoin prices higher. + I'm...


![Bitcoin[BTC] - Do you see a similarity ? BTCUSD: Bitcoin[BTC] - Do you see a similarity ?](https://s3.tradingview.com/w/wwM5w2jt_mid.png)


![Bitcoin [BTC] - Trading Inside the Channel. Breakout when ? BTCUSDT: Bitcoin [BTC] - Trading Inside the Channel. Breakout when ?](https://s3.tradingview.com/x/XUaddHDP_mid.png)


