Victor_79
Popular Web3 Growth Manager Cas Abbé asserts that the end of the Ripple lawsuit sets the stage for a further XRP rally to the double-digit range. Abbé made the declaration in an X thread over the weekend as he highlighted the impact of the lawsuit’s resolution on XRP’s price. The expert indicated that the lawsuit’s resolution has already been priced in, as the...
From the beginning of impulse movement, XRP just has 50% correction while the chance of sellers is going over. It shows the power of Bears is going weak and down. So I believe for starting a new impulse wave XRP will be in Range condition for a short time and then bulls backs. If 50% fibonachi can't support the price ,the next support will be around 1.70$.
3 times Chain of +Dv in MACD, supporting level, breaking the down trade lin and end of correction time shows to change the structure to up trend. I think here is the low risk to buy.
It's the whole cycle waves of BTC from the beginning to present time. According to the cycle, BTC is in the second wave of third cycle. So I think this price is the cheapest that can invest for hold.
Three times of increasing depth of range, now it's time for growth to break the 108000 just like the previous movement. I think BTC never goes to nuder 76000 even touch that point. I'm strongly bullish on BTC from now.
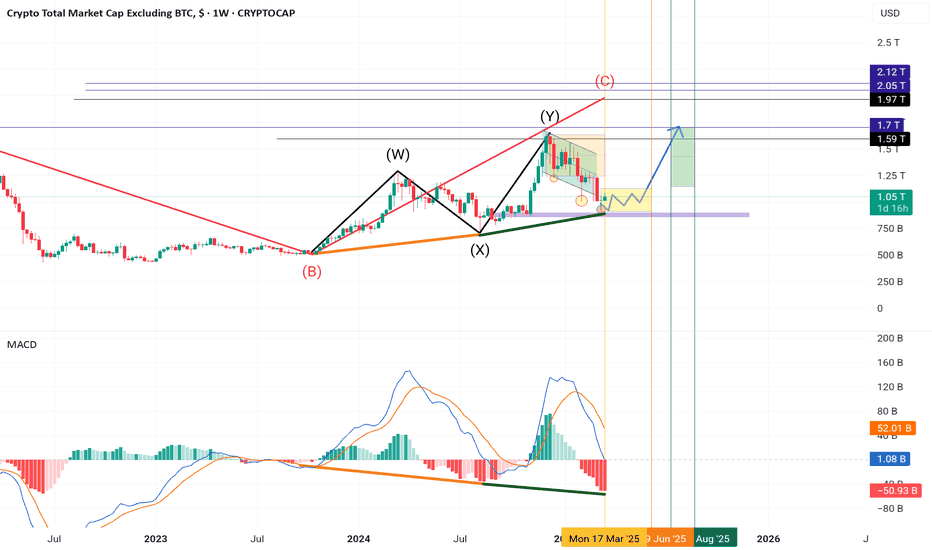
The divergence of HD+ in the altcoin index (weekly timeframe) indicates a potential pattern. Following the BX movement, we experienced the XY growth. If the previous step repeats, we can expect growth from the current range. Additionally, during the recent correction, we observed an increase in the depth of the range three times, similar to the previous corrective step.
According to chart, BTC makes a bluish structure in range. I think It's an alert to break the resistance soon and jump to 40,000 $. We can get a buy position after breaking the resistance level by a bluish candle close above the level.
EURUSD correction movement , meeting the 61 % of 25 of May in 2021 high , making down trand pattern and also berish divergance in MACD ( -RD ) showes that UP trand is going to shift to DOWN TRAND.
Down trend is over. As you see the Down side channel is broken. All resistance level are fibonacci overlap so they are strong enough to reject the price in first or second touch and also support if they break. The color of each level shows that how much it is strong.
I thinke this long cycle is going to happe. At the end of Noveber 2023 EURUSD will reach to the lowest part of cycle and the ir will increase
This is the long periode of EURUSD cycle in 2023. I think it will happen at the end of 2023.


