VisionaryInsights
EssentialBitcoin has broken below a key dynamic support zone, and current price action signals a potential continuation to the downside. This short entry is supported by multiple technical confluences: 🔻 Bearish Confluences: Fibonacci Retracement Rejection: Price rejected the 61.8% Fib retracement zone near $114,978, confirming a potential local top. Trend Structure:...
Gold (XAUUSD) just tapped into a key liquidity zone near the 38.2% Fibonacci retracement at $3,364, followed by a sharp rejection. This aligns with the upper channel resistance and a bearish confluence from previous supply zones. Price has failed to break above the dynamic EMA cluster and is showing signs of exhaustion after a relief rally. If momentum follows...
Gold is currently in a clear downtrend after failing to hold above the mid-channel. Price is retracing into a potential short zone with confluence from the moving average bands. Fibonacci Retracement: Price is reacting near the 38.2% level (3,318). Downside Fibonacci Targets: 1️⃣ 3,249.36 (38.2%) 2️⃣ 3,228.11 (61.8%) 3️⃣ 3,193.73 (100%) As long as the price...
Gold (XAUUSD) has shown strong bullish rejection from the lower volatility band after a sharp selloff. The appearance of a Heikin Ashi reversal candle, suggests a short-term reversal is forming. Price has reclaimed key structure and is now targeting a reversion back to the mean, supported by Fibonacci retracement levels. Entry: 3293.55 Target Zone: 3308.91 →...
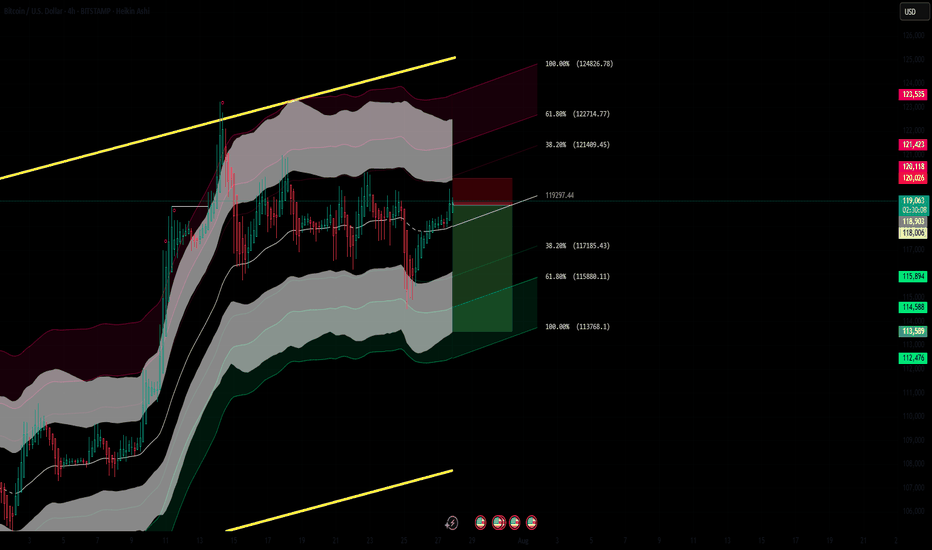
Bitcoin is currently trading within a defined range under macro resistance. The chart shows price stalling below a key supply zone, with rejection from the upper Keltner Channel and diagonal resistance (yellow trendline). A local bearish divergence appears to be playing out as momentum fades. 📉 Short Position Setup: Entry: $119,275 (supply retest) Stop Loss:...
Gold (XAUUSD) has broken below the dynamic support zone of the Keltner Channel structure and is currently trading beneath the 200 EMA zone, signaling bearish momentum. Price has rejected the upper resistance band near 3385, forming a lower high and triggering a short entry at the 38.2% Fibonacci retracement zone. 📉 Trade Idea (Short Bias) Entry: Around 3360 TP1:...
Gold is currently in a retracement phase after breaking below the mid Keltner channel zone. The small upward arrow marks this temporary relief rally, which I anticipate will be short-lived. Price is testing the lower band of the inner Keltner channel after rejecting from the upper zones. The structure suggests a classic lower high formation before a potential...
As of today’s close, Bitcoin (BTCUSD) is showing early signs of a potential bullish reversal from a key mid-range Keltner Channel support zone. The recent Heikin Ashi candle reflects a strong recovery after a brief sell-off, with price rejecting lower support levels and closing firmly within the mid-band. 🔹 Key Observations: Support Zone Respected: Price action...
EUR/USD has pushed into the upper boundary of the Keltner Channel on the 4H timeframe, indicating a potential exhaustion of bullish momentum. Price is showing signs of overextension with Heikin Ashi candles losing strength near a key resistance zone. 📉 Short Position Setup: Entry: 1.17220 (near upper Keltner resistance) SL: 1.17581 (above recent highs and...
Gold is currently facing resistance near the mid-Keltner Channel zone. Based on current structure and momentum, we anticipate a two-phase move: 🔻 Phase 1 – Short-Term Pullback: Price is likely to reject the current resistance and move lower into the demand zone around 3310–3315. This retracement aligns with a healthy correction within a larger structure. 🟢...
Gold is showing signs of potential downside pressure on the 4-hour chart. After a rejection from the upper volatility band and a failure to sustain bullish momentum above the dynamic EMA cloud, price has rolled over and is now trading below the midline support area. 🔻 Bearish Structure Developing: Price rejected strongly from the upper gray zone (Resistance...
Gold (XAUUSD) remains in a strong long-term uptrend, respecting a well-defined ascending channel on the weekly timeframe. Price is currently testing the upper boundary of this channel, suggesting potential exhaustion near the resistance zone. A bearish rejection from this area could trigger a corrective move toward the lower boundary of the channel, aligning with...
Bitcoin broke the weekly channel last week. I expect a decline to 45K Stop loss: 97600
There is a possible bearish move on the 1-hour timeframe. There is rising wedge pattern using two converging yellow trendlines, this is a classic bearish reversal structure. The wedge shows price making higher highs and higher lows, but with decreasing momentum. Stop-Loss is marked above a recent swing high Take-Profit is set near the lower ascending trendline,...
Gold just broke the channel. I expect a rapid decline the following hours to 3080 and if that breaks, 3050
Gold just broke the channel. There is a potential bearish move to 3080 and if that breaks, 3050
There is a potential bullish move on the 4 hour chart. Gold is trading in the Resistance zone, near the lower line of the channel. Stop loss: 3127 Take profit: Around 3270
There is a potential sell on the 4 hour chart. I expect NZD CAD to start declining to at least 0.817 Stop loss: 0.8273 TP : Around 0.817


