REASONS FOR THE SHORT SETUP! 1) Rising Wedge formation 2) Strong bearish divergence in RSI 3) There is a good Strong momentous Breakout of the wedge pattern 5) Currently on support from where it will bounce to retest the breakout that's where the bears will step in 6) Potential 300 pips setup will update on the retest 7) Trade only possible if i Get a...
Broke a major rising wedge on m15 after forming a double top. Currently retesting the broken trendline and neckline of double top. In the process has also formed bearish pennant in consolidation. As soon as it breaks the pennant, we can see a downward movement. If the m15 candle closes below 1777 i am in for a short here with tp at 1770, 1767
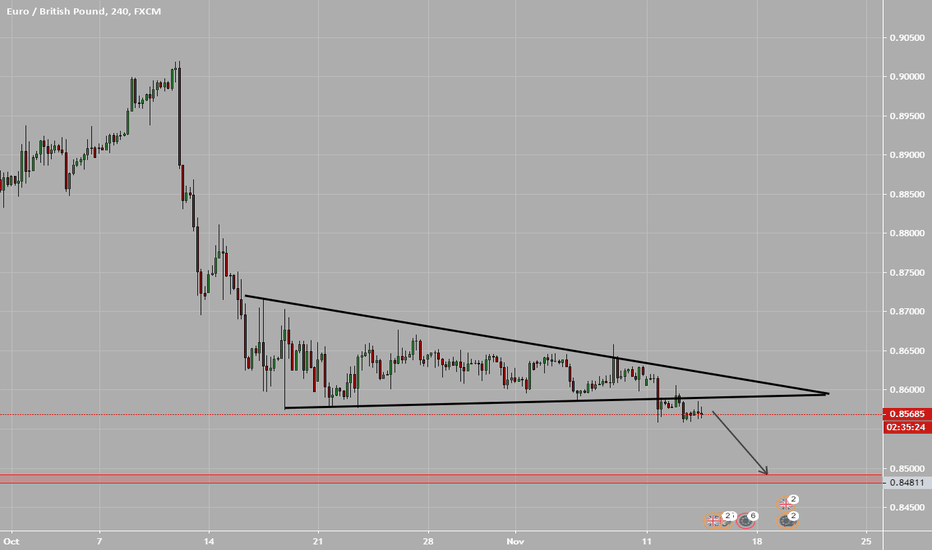
EURGBP is on a continous downtrend from some time. It consolidated for a little time and form a bear penant in the down trend. It has broken the penant and retested. I have entered for short here the risk to rewards is high. Tp is almost 70-80 pips. Because if you see the daily chart then it has broken the trendline and is ready to text the next support. So i am...
Cadchf has broken the channel and it has already retested the trendline. On retest it show very good rejection. As it can be seen in the chart below: THe second thing that gives me confidence about selling at this point is the head and shoulder formation which has been confirmed by the breakout of neckline and retest. I have placed a sell here and I have my tp...
It is actually a day trade. I may get more pips here but I am not targeting big. 20-30 pips for me will be enough. The lopgic behind this trade is just support and resistance. There is a spining top formed after strong green candles showing that the buyers are not in a mood to keep the market going up. And the spinning top is formed at the resistance zone which is...
Broken the bear flag and retested it too. Placed a sale here. Target at the black line where the arrow head is. FOLLOW AT YOUR OWN RISK.
EurNzd was moving in a falling wedge pattern and a triangle pattern as well. And now it had broken the resisting trendline . BUt I am waiting for a retest to enter the market. If i enter then the target will be the red box. I will update here with a chart when I enter the market. It can be a fakeout so thats why I am waiting for retest.
AUDUSD was moving in an ascending channel and it has broken out. I am waiting for a retest on h4 to enter the trade. THe point that I am looking for the retest is the white dotted line. FOLLOW AT YOUR OWN RISK
A double top is in completion. It has already broken the neckline. And currently I am waiting for a retest. If it Retests it and gives me a signal I will will be entering for short here.
Dear traders, In EUR/USD there is a double top pattern created. For all those who don't know about the double top, it is a pattern that is formed in an uptrend indicating a trend reversal and a move down. I have marked the two tops that are almost at the same level with two shaded eclipses. THe red zone that you are looking at is the neckline of double top. When...
1) First We should consider the trendline test. 2) Ichimoku cloud is bearish 3) Bearish flag breakout happened. Target according to its pole is around 4k. 4) Rsi moved below 50. 5) TTM Squeeze turned bearish. All strong bearish signs indicating the fifth wave to end at 4k region. Will take atleast month to reach there. Its not a financial advice. Do your own research.


