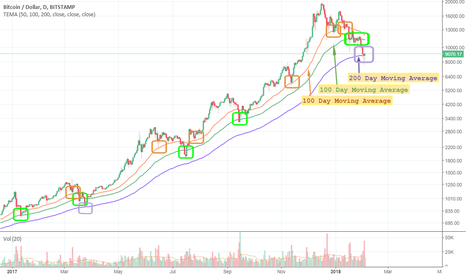
As we can see, the 50, 100, and 200 day moving averages were solid support points throughout 2017. Once Bitcoin touches the 200 day moving average (at a rate of less than once per year) historically it rebounds very, very strongly. Edit: Made a typo. The orange text description should say "50 day moving average". Sorry!
This is the first time it's reached the 200 DMA since March 25, 2017 where it dipped to $895. Before that, it went below the 200 DMA on 8/2/2015 to $470. This is the real test in terms of chart plays. Could bounce here or we could be entering a bear market.
Yesterday I talked about BTC's trend of bouncing off of the 100 DMA. Today we see a perfect Doji is forming EXACTLY on the 100 DMA, which is a very strong reversal indicator.
BTC quite clearly finds support at the 50 day MA then occasionally it tests the 100 day MA in which case it almost always goes on to find new highs.


