WSBB
PremiumWatching DAL for potential continuation to the downside. Price is still holding under key resistance and failing to reclaim structure. If we see a retracement toward the $40.30–$40.80 zone, I’ll be looking for rejection and confirmation to enter short. Day trading targets are $39.10, $38.60, and $38.00. All those levels aligned with previous price reactions and...
Tickers like SOFI I enjoy swing trading while simultaneously buying shares of equity. Currently in a very clean downtrending channel. Perfect for swing trades. As this ticker moves around $2 per week, the day trading levels are very precise entries; this ticker is built for swinging and investing.
PLTR has a clear swing trading range for us: 66.41 to 100.45 to 120. While this might seem wide- remember, I'm saying a swing trade. I'd buy LEAP's with a hold of 100. Earnings 5/5 with an increase in IV. If you plan to swing, make sure your expir is at least 30 days past the Earnings Report date. Earnings is expected to be above 110 or below 85
I like this set up for affordable and stable LEAP's. If price can break above the range, we will see a run to 31. INTC's fundamentals are still a bit iffy, BUT the chip industry is hot. This would make a great sympathy play- I'd lean towards buying equity over options contracts. For Day Trades- expect price to range between 18-22 going into the 4/25 expiry
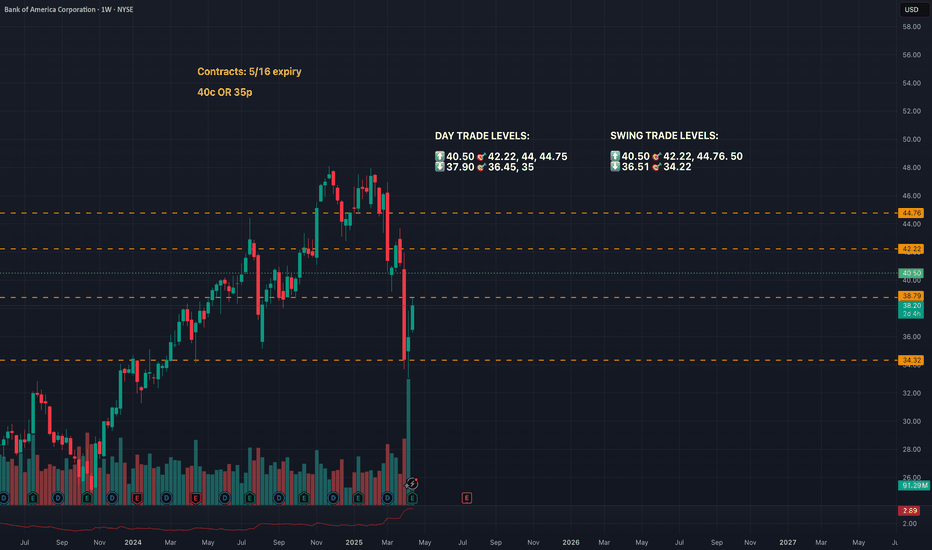
I'm not mad at this for a swing trade! The chart is leaning bearish. Would like to see a reject at the trend line or entry below 44.22.
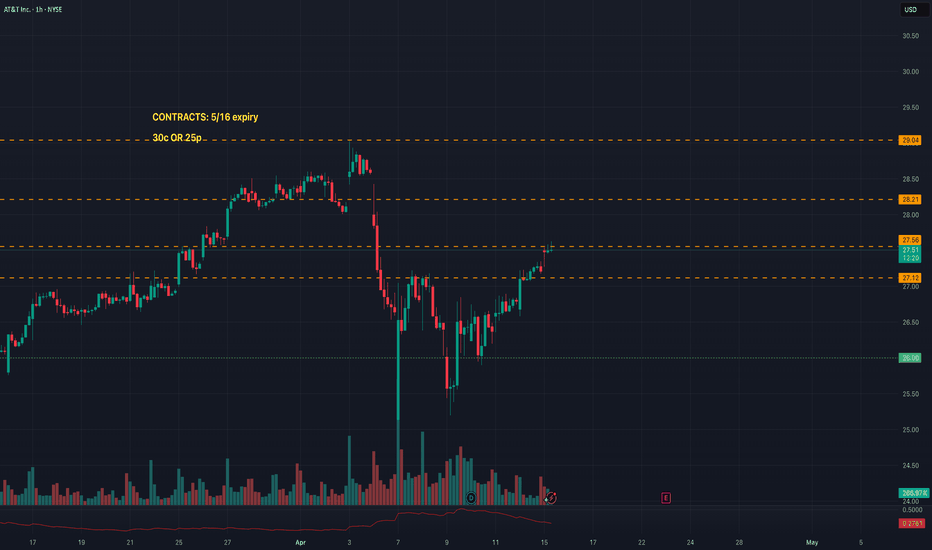
You might notice that this is the Hourly timeframe. For a ticker that moves 0.83 cents/day, I just needed to know the directional bias up top (ranging but leaning bullish). I would expect day trades to move level to level. The contracts listed will be your best options whether day or swing trading.
Traded down to the previous demand zone around 34. Has yet to break the range of the bearish weekly candle.
Either or set-up while in this range. For day trades, expect price to move between 64.86-66.30 where there is a daily gap down. For now, the gap is acting as resistance. When trading gaps, it depends on your objective. Scalpers might be interested in playing off the H/L of the gap. While intraday traders will be more interested in trading once price breaks...
The financial sector interests me, especially with an upcoming interest rate meeting, earnings report, and declining consumer sentiment. Ultimately, I like to swing the Sector ETF's but they also make for affordable day trades! With XLF being in a tight range on the Weekly+ timeframes, it makes it easy to daytrade within those levels.
NYSE:SQ With the FED's announcement of possibly only TWO rate cuts in 2025, my eye is on companies like NYSE:SQ , NASDAQ:AFRM , and $PYPL. NYSE:SQ had the most beautiful set-up, to me, so I began here! The "perfect" set-up to me would be if the potential H&S pattern played out and we saw SQ push back towards the 92.65 level, reject back down towards...
META already entered into it's earnings gap up. My bias is towards a continuation of this gap fill and looking to enter below a break of 171 eyeing 167.45, 163.25, 158, and 153.76. At the final level, I will look to see if META bounces or continues to fall below. I will also eye the 171 level for a possible bounce.
I'm loving how AMD looks across the board! On the Daily, we have the 200 holding as support at 79, and the 10ma holding it as resistance around 82.56. MACD is starting to show weakness on the D with the histogram fading and losing momentum and it looks as if the MACD line is about to cross below he signal line. I will look to enter towards the downside if we...
AMZN consolidating on the primary trend line and the wedge of the secondary trend line. A break above the daily 100ma, at 99.75, I'll look to take it to 101.18, 103.63. Between the 200ma, 100ma, and 50ma, AMZN has rejected the primary trend line and broke below a key level at 103.63 and closed below both the 200 and 100ma. The next Moving Average support...
CPI data, jobless claims, housing starts! The Economic Calendar has a full week ahead and I believe this will be one of the deciding factors into what the market will do in this pullback. Broke an important supply zone around 408/409 and pulled back Thursday and closed on it on Friday. This week my eye is on data and if we break above 408.85 to take profit at...
Chart patterns are very subjective. I see this as a symmetrical triangle, meaning it could break in either direction. But if I adjust my trend line, I also see it as a rising wedge, which is a bearish chart pattern. Either way, I will look for a break above 45 for calls with a target of 50.30, OR a break below with a target of 41. Either move will be an amazing swing!
NASDAQ:NVDA I like what I see when looking at the Daily. In just over a month, it has gone from 130 to 221; almost a $100 gain! We see it formed a base, which we can now see was an accumulation at the demand zone, and broke above 1/9 around $153. Met resistance around 194.50 where it previously resisted in 12/13 and completed a double top between 8/4 and...
After news came out about their new initiative to give people on the way to a job interview a free ride, my eyes have been on LYFT. I immediately took note of their fundamentals.. whew! In its history, its only missed earnings twice! In my opinion, LYFT has longevity potential! With earnings coming up next Thursday, I love the position this stock is sitting in...
With Oil companies reporting earnings and also a majority of them attempting to break ATH, I have my eyes on SHEL, CVX, and XOM. CVX and XOM already reported earnings and did not have an all around beat but CVX beat revenue and XOM beat earnings! SHEL is set to report their earnings on Thursday pre- market and I will be looking to enter into a swing in either...


