WaveRider1423
This is my Logarithmic Curve Chart, originally post in January 2020, find link here below. I have adjusted the chart to include the halving events and see what we may glean as to price behavior relative to the halving events and where we are in the cycle. All information is on the chart.
All info is on the chart:
This is an EW analysis on the weekly chart for BTCUSD on a log scale. It removes a lot of the noise and provides more prospective on a relative basis with broader context. With this approach we can see the entire history of BTCUSD and get a better view where we are in the cycle of the larger wave sequence and is not intended to address any smaller time frame...
The chart speaks for itself and is just my opinion. Looking for intermediate wave (4),blue labels, to correct to the area of minor wave 4(green labels) of one lessor degree between $5000 and $3000, highlighted in yellow, before breaking ATH. Since intermediate wave (2), blue labels, was a ABC Zig-Zag then intermediate wave (4), blue labels, favors an ABC Flat or a...
BTCUSD Daily Chart - The most expansive move in BTC history is setting up right now. Following the the bull run which completed on 17 Dec 2017 at $19,666 we have a classic ABC Zig-Zag correction that completed on 06 Feb 2018 at $5,920. This is the level the bulls need to defend if we are to resume the bullish trend and start the early stages of development of...
A look at the bigger picture shows the Kiwi under pressure and vulnerable to further downside moves. This analysis is on a monthly chart and therefore does not address excursions on the shorter times. The kiwi is oversold on every time frame from the monthly to the 4 hr charts and would suggest we are due for a pullback however pullbacks so far have been shallow...
We are due for a move soon one way or the other of about $200 and if the long term base trend line does not hold, $250ish zone, then $65 is well within sight.
Price has maintained it buoyancy above both it's 8 year and 29 year trend line, MACD continues to build momentum to the upside and RSI looking for new highs: buy the dips.
US Dollar Index breaks its 29 year trend line. This is a monthly chart and therefore does not attempt to address the smaller time frame excursions as the dollar pushes higher. Although we have another week yet before the monthly close we are looking somewhat buoyant as the MACD continues to build momentum above its zero line and RSI has moved into bullish...
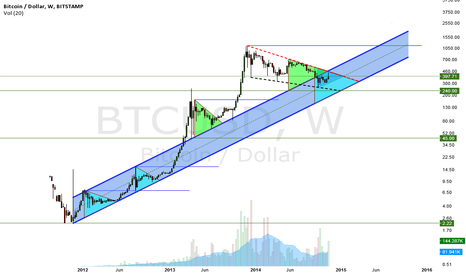
Not much to mention here; the chart speaks for itself; basic support and resistance. Technically, the current downward correction remains intact. Likewise the longer term bull run also remains intact. Fundamentally, over the long term I am more bullish than not, so I would be happy to buy wherever price touches the bottom of the long term base channel. If I am...
I'm lining up with the bulls at $240
Support level at $240, last line of defense for the Bulls
Price has clearly broken into the gently rising long term baseline channel (blue)and appears to be searching for the bottom of the channel. If price is contained by the current gently down sloping channel (red) we should find the bottom some where around the end of the year or early next year, We have a confluence of support in the $200-$260 range and this is an...
Possible path for bitcoin as an long term investment. Other support levels are indicated on the chart in red horizontal lines. I am waiting to see what happens next but it is hard to resists the risk to reward
All info is on the Chart and self explantory.
If price remains in the gently down slopping channel we could find strong demand at the intersection with the top of the base line channel by year end at about $420. A break below this level could bring us to the bottom of the base line channel in the low $200 and another strong demand zone. I placed a fib structure on the RSI ( borrowed from Constance Brown,...


