WealthKraft
Premium1. Long once 25415 - 25440 is broken for target of 25541 and second target of 25610. 2. Short only after the support zone of 25336 - 25291 is broken for target of 25165 and second target of 25000. 3. No trading zone with be todays range of 25340-25410
As the market was in the range of 25548-25425 i.e. traded within the support and resistance, one can plan long/ short: 1. Long once 25560 is broken for target of 25580 and second target of 25610. 2. Short only after the strong support zone of 25415 is broken for target of 25370 and second target of 25336. Do keep in mind of the trendline which will act as...
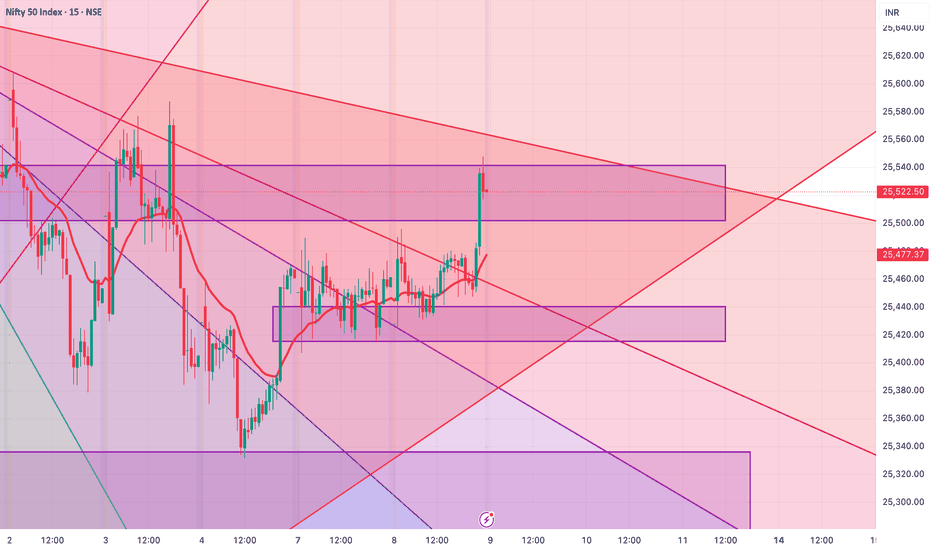
Please watch out for levels in Nifty for 09 July 2025 1. Long once 25542/50 for target of 25580 and second target of 25610. 2. Short only after the strong support zone of 25415 is broken for target of 25370 and second target of 25336. 3. 25523-25440 are the no trade/ sideways zone. However, if a strong rejection candle is formed at either of the zones, they...
Please watch out for levels in Nifty for 08 July 2025 1. Long after 25490 for target of 25522 -25555. 2. Short after 25390 for target of 25337 and if this is broken with volume we can look for 25253. 3. 25490-25392 are the no trade/ sideways zone Also we have see the rejection from the trendline above, so kindly watchout incase of gap-up
I. Long entry reason: 1. Breakout from Key Resistance BTC had closed above the previous resistance zone (~84,500-84,800), signaling strength. The breakout candle had a good body-to-wick ratio, meaning strong buying momentum. 2. Higher Lows Formation Before the entry candle, BTC made a higher low (~83,759), confirming bullish structure. This showed that...
1. Price Action & Trend Analysis The NIFTY Futures has been in a strong downtrend since October 2024, with lower highs and lower lows. A black downward trendline is clearly acting as a dynamic resistance, rejecting price multiple times. 2. Gann Fan Analysis: The Gann fan lines are visible, providing different angles of support and resistance. The...
NSE:LT A bullish pennant has been identified on LT. It is a pattern that appears after a strong upward price movement, which shows that the bullish trend is likely to continue. This pattern is characterised by a brief consolidation period, where the price moves within converging trendlines that form a small symmetrical triangle, resembling a pennant. ...
BITSTAMP:BTCUSD Consider entering a long position once the price breaks above the high of the green candle, indicating a potential upward momentum. Place the stop loss (SL) at the recent swing low for risk management. Target Levels: Target 1: 63,927 Target 2: 64,749 This trade setup aligns with the breakout from a falling wedge pattern, which is a...
A rising wedge pattern has been identified on the daily timeframe for the stock. Traders should wait for the trend line to be breached. Once it is broken, set a stop loss at the swing high and use a trailing stop loss. The three targets are based on the stock's immediate support levels. Note - Please consult your financial advisor before engaging in trading...
NSE:HINDUNILVR HINDUNILVR has created Inverted Head and Shoulders as well as a Cup and Handle pattern. For both we measure the dept of its head and cup to mark its short term target as it is on day time frame which could yield a short term gain if the neckline is broken. Note - This is for educational purpose, in case you want to trade kindly consult...
The stock has made a perfect Head and Shoulders chart pattern, if it breaks its neck;ine and support zones then a downfall and good correction can be seen


