WhiskeyTangoFoxtrot3
The put to call ratio is simply the ratio of short options over long options in the S&P 500. What sticks out to me is that the ratio saw its second highest level in December of 2018. While a bottom of .3 percent would likely signal irrational exuberance as had been suffered in 2007, it seems since 2012 a bottom target is .6 percent. While the market melts up under...
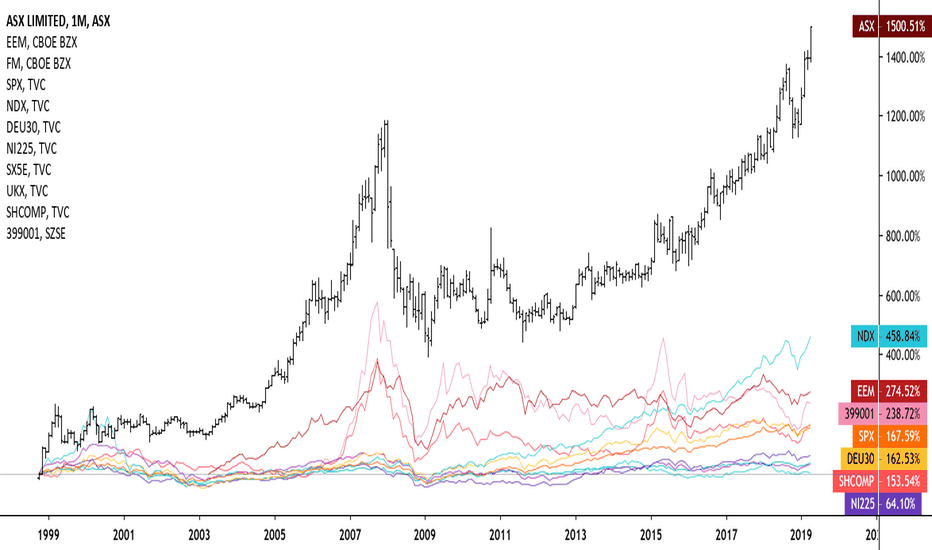
Australia hasn't suffered from a recession in more than two decades. Its stock market highlights this fact as it has risen 1400 percent since 1999, a feat which no other major equity market in the world is even close to accomplishing.
Emerging market ETFs are on my mind this weekend as I contemplate risk on assets that outperform US benchmark ETFs and can act as a form of high portfolio growth (also high portfolio beta in some instances) in a time when real yield is insatiable. Mainly, I want to focus on an emerging market ETF, EMQQ. It outperforms the most liquid China ETF, EEM, and focuses on...
This chart kind of speaks for itself. Without a doubt, EMQQ is a higher performing ETF than EEM while the former focuses more on the Chinese consumer and the internet companies in the Middle Kingdom.
Compared to its competitors, there's really not much reason to get into EMFM. Brought to my attention by Bloomberg ETFs. Now I am particularly interested in all these ETFs they put out and how their relative performance. Clearly, EMFM is correlated with its peers, mostly the China-focused EM fund. However, again, they're simply better alterntives.
Marketplace analysis of attempting to determine Chinese macroeconomic stability and growth is insatiable. Because of this, I am continuously interested in finding proxies for the Chinese economy since low- to medium-frequency data out of China (GDP or manufacturing figures) are notoriously inaccurate. With South Korean GDP figures out this week unexpectedly low...
My fascination for the Australian dollar as a proxy for China is insatiable, but here's another attempt at alleviating this. Here is the Aussie dollar, the Hang Seng, the Shanghai Composite, and the coal future spot market in Hong Kong. Correlation coefficients are below. I would love to run a vector autoregression to see if this is a statistically significant...
This is an interesting relationship to me. Lumber prices are highly tied to the housing market as home building demand primarily affects lumber since our houses are made out of the stuff. Housing also reflects a broader sentiment in the overall economy.
"Use this similar to how you use a kumo cloud" according to the guy who made the script. Let's see how it works. I'll probably publish this with a number of charts just to see how well it works.
Support broken. Let's see how far it can go. Most likely institutions doubling down on their short positions before the April 12th deadline was extending and being more than happy to sell buy orders from the retailers who were nearly entirely long according to sentiment data from IG as could be found at Daily FX. "Use this similar to how you use a kumo cloud"...
"Use this similar to how you use a kumo cloud" according to the guy who made the script. Let's see how it works. I'll probably publish this with a number of charts just to see how well it works.
"Use this similar to how you use a kumo cloud" according to the guy who made the script. Let's see how it works. I'll probably publish this with a number of charts just to see how well it works.
"Use this similar to how you use a kumo cloud" according to the guy who made the script. Let's see how it works. I'll probably publish this with a number of charts just to see how well it works.
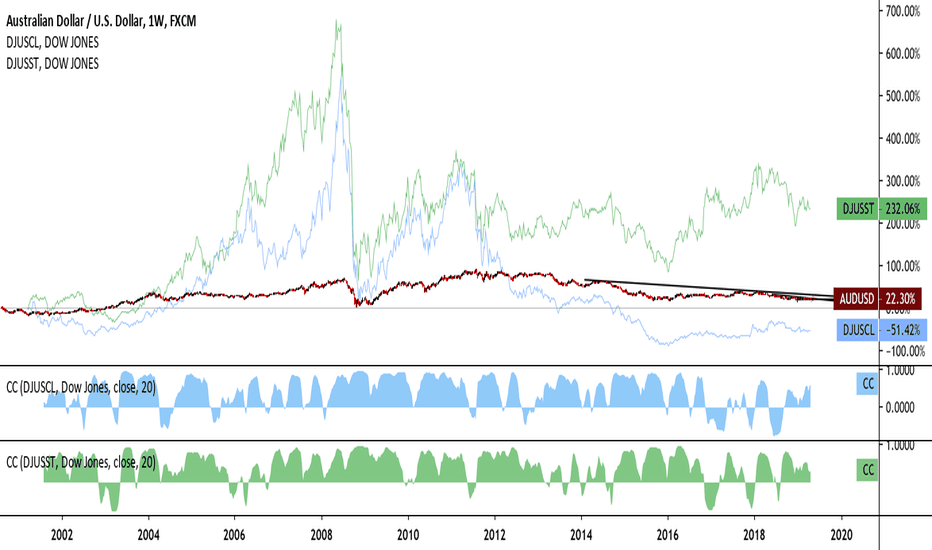
I've been taking quite a deep look at the relationship between correlatives of the Australian dollar lately. There's no question that this deep dive would be remiss without looking at correlation coefficients between AUDUSD and that of commodities it exports, primarily iron ore and coal. The chart really speaks for itself. Aussie dollar sees strength when coal and...
While it seems that price action is now using previous resistance as support, RSI and stochastic are flashing overbought. There is a fear that US equities are 'melting up' where retailers are suffering from 'fear of missing out' which is typically an indicator of a market top. This is on the back of low volume, RSI and stochastic nearly flashing and flashing...
This is a chart of Brent minus WTI, the former of which is typically more expensive since it takes more to refine while the latter tends to be the opposite. A rise in price action of this difference demonstrates less of a speculative appetite for petroleum consumption and more of demand since a price differential suggests increased competitiveness in Atlantic oil markets.
The crowd may be right on their net long position for a few reasons. Price action has hit support while the Chaikin an stochastic oscillators suggest the pound is severely oversold. The UK is ready to gear up for EU Parliamentary elections on the other hand. Since the center left and center right pro-remain parties refuse to coordinate for an electoral and...
I imagine there are quite a few sell orders at the record high. Perhaps though we should imagine what the position of the hedge funds are though. Do they want to drive this up even further? Or are they want to position for a significant reversal? Remember they don't care which way the market goes just as long as they can make some money on it. The crowd is net...


