XRP is showing signs of a massive bull run. XRP is showing a massive elliot wave formation as it in in 2017. XRP is at: The bottom of the C leg 2 Macro Elliot wave show a wave 3 formation. Will it bust out of the triangle into a parabolic push up as it did in 2017?
Leg 4 might be running sidways as it did in 2016. Leg 5 has not completed yet. Smelling a small rally/bull trap to $0.51 (Spring 2023) and a retest of $0.17 for the double bottom before a paraboilic push up.
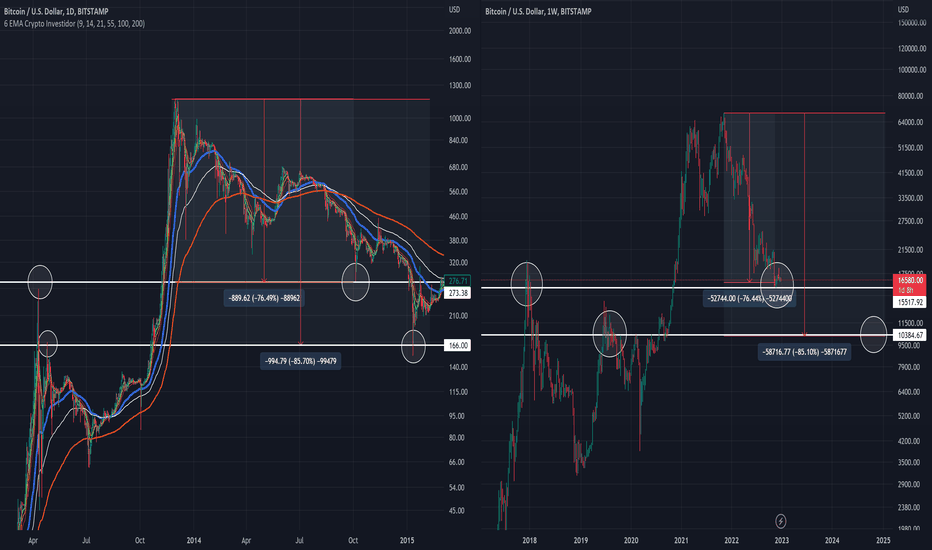
Another view of how BTC can dip below a previous 2013 ATH to meet the 85% Draw Down. 75% Draw Downs happen and continue on, but what are your thoughts? Bearish or Bullish?
FACTS: BTC Draws Down 85% from the ATH. BTC has GONE BELOW the ATH in Jan/2015. BTC is currently 75% Draw Down. If it continues THIS cycle, BTC will hit the $10.3k price target @ the bottom og the Channel meeting the 85% Draw Down narrative be early Spring. PRICE: $10.3k WHEN: Late Jan 2023 to Feb 2023 $7k Trend Line CRASH Narrative: (89% Draw Down) - Unlikely?
XRP is getting closer to breaking out of the triangle more than likely based on the Ripple/SEC lawsuit. Once it does, XRP might knock the ceiling of the triangle, and shoot straight to the 0.702FIB ($0.87), and retest the 0.236FIB ($0.41). 160% Gains from here. GREAT Trading opporunities are coming up.
Bitcoin could touch the $7.6k arena if BTC touches the Macro trend line to meet the full 88% draw down. TOTAL 1 shows the 88% draw down touching the trend line as well. Lets see if this narrative plays out.
It seems BTC crashes to the all time lows after a breakout of the rsi. Is a $12k - $14k Bitcoin in route? #bitcoincrash
There may be a small rally to the 0.702FIB and a retest of the trend line @ $0.41. The $0.65 mark is a crucial resistance to watch for! Take profits, btfd. =================== Projected Short Prices: $0.65 /0.702FIB $0.71 /0.786FIB
Im convinced history will repeat and the 2018 ATH (3.618 c.FIB) will hit a price tag of $276/XRP by 2025. The 2013 c.FIB nailed the 3.618 target price ($3.31) in 2018 ATH. ==========IMHO===== The trend is broken, but thinking there is another larger trend to be broken right after the 90% Draw Down in 2017 right before the massive parabolic green candle. There...
The 2016 XRP Draw Down was 89%. Will history repeat in 2023? I compared the TOTAL3 (altcoins) 2018 Fractal and nearly nailed out the full 89% Draw Down ALTCOIN market. There might be a small pump before the HUGE dump to the full 89% Draw Down. Altcoin Rally: - Potentially Ripple SEC news comes out? - FedNOW (SkyNET) Goes online Mar 2023 and everything crashes...
When in doubt Zoom out. A picture can paint a thousand words. 85% Draw Down? 75% Draw Down? IMHO, Bearish looking to play the Bull trap back down to $10k btc.
BTC is looking to meet the Trend line @ $19k. BTC will need a candle close above the trend line in the $20k arena. BTC will need to enter the $21.5k arena tfor the bulls to stretch their legs. GOOD LUCK ALL!
BTC is in for another repeat of history. After a 75% draw down from the previous ATH, BTC seems to drop another 40% from the 75% draw down level to meet the historic 85% draw down narrative. BULL TRAP Zone: $18.1k to $20k Correction to $16k
% Gains from $17.3k $10.3k (wick grab) = 66% $11.5k = 50% $12.9k = 32% $14.4k = 18% Shout out to all knife catchers! Hope everyone can hit their price targets. GL all.
Bitcoin has decoupled from the DJI for the first time. 11/7/23 Will there be an explosive move to correct? Will this trend continue?
BTC Buy zones $10k - $11.8k - Demand Buy *85% Draw Down Zone $11.8k - $13.8k - DCA Zone $13.8k - $16.6k - (watch zone) $17k - $21k *75% Draw Down Zone.
The 2018 fractal seems to be playing out flexing to the Golden Ratio ($6900.00) Spring 2023 shows a price spice t0 $4300.00 and a retrace. Feb 2023 seems to be a slow crunch upwards. Lets see if this narrative plays out.
2023-2025 will be the year of Crypto. Currently: - Possible drop/wick down to $13k. - The Democrats won, a storm may be coming. - I expect sideways actions and a shakeout Nov/Dec. - CNBC / Jim Cramer FEAR is running rampant!! www.msn.com www.cnbc.com Inverse Cramer ETF (Not Jim Cramer): twitter.com *Follow for Anti MSM Fear Campaign. 6 year Cycle Narrative (...


![$10.3k #BTC - [Jan/Feb 2023 ] BTCUSD: $10.3k #BTC - [Jan/Feb 2023 ]](https://s3.tradingview.com/0/0L58SWIp_mid.png)


