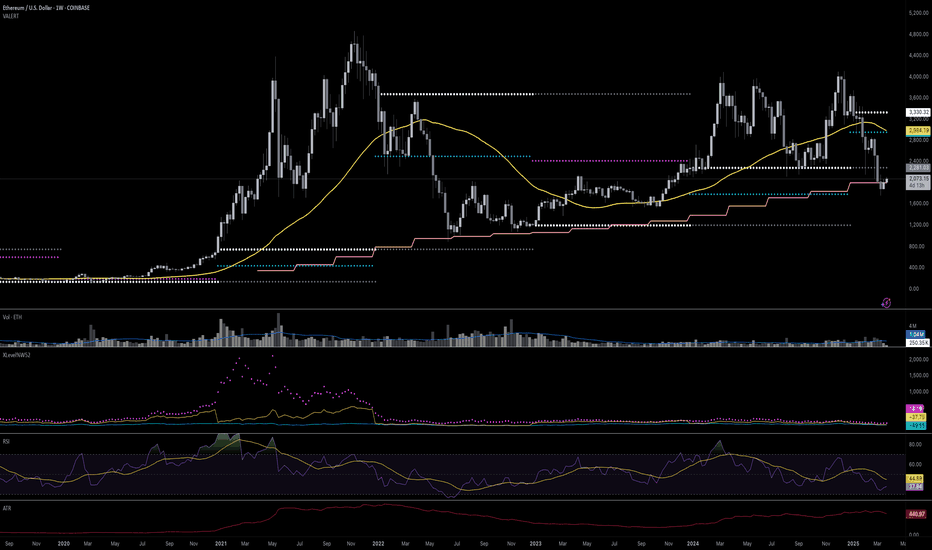
ETH is currently at a critical juncture. The price is testing a key support level at 2,074.52 USD after a 31% pullback from its recent high. Technical indicators like RSI and volume suggest that the downward momentum may be slowing, but confirmation of a reversal is needed (e.g., a break above 2,281.03 USD with increased volume). On the other hand, a break below...
Its buy zone and a bullish candle. You know what to do :)
Copper broke down trend yesterday and it is a double bottom pattern. If it manages today above ma line. I will buy.
Please find my attached analysis Japanese yen . This is a chart showing Japanese yen strenght . This figure actually Japanese yen average value to G7 cureencies. Last time we see this level was 2007 and after 9 months we had Lehman Brothers bankrupcy and 2008 subprime crisis. I am wondering what will be next?
Dax risinging vedge is broken. Watching closly and shorting
BTC broken the steepy angle trend line. Watching for a pullback.
Waiting for reversal signal. This was a strong support for sereval times.
Very low volatility nicely trending up. Adding to position here.
I will be entering short once the blue line broken
testing important chanel down trend 's upper line. Waching for reversal signals
Falling vedge pattern broken yesterday. And retested now and still closed outside. Watching for move towards1.19
EURUSD has borken the falling trend line. Ready to go up. Probably no tapering news yet from Jackson Hall.
Nice double bottom at hourly chart. Oil going down and cad highly depending on it.
We are trending down and with Jackson hole volatility if we make it upper line of channel I will short. See what happens.
Fundemantally: JPY buying pressure fade because of FOMC meeting this week. US10Y remains under 3% which is positive for indices etc. and possitive for USDJPY Technically: I see a RSI divergence at hourly chart. We actutally broke the main downtrend line long ago and gathering liquidity for upside breakout.
USDJPY wants to go lower but not now. Dolar is firm . And JPY buying pressure is down. RSI divergence and 1 hour chart.


