YMaki
three potential target used the fib retracement and confluence appears assuming the start of the 1st leg of the downward trend was the startig point, target 2 will align exactly with Fib 0.618 assuming the start if the leg was 2.929 then target 3 will brush the 0,382 fib i drew the lines first and decidd to check the fib zones and align perfectly
its time for profit taking for some, possible scenarios atleast 200% can be made here cleary there there was an inverse HnS with target until 96K the price is likey to csmash that resisttant line and peak up yo 106K where the initial reversal began in Jan. could it be a triple top and continue decline below 60k OR make its way towards our weekly main target...
some possible scenarios observation rsdi over stretched wedgee breaout and retrace btc entering a corrective wave similar price action result with over 20 % for eveyr move 10x leverage you can secure atleast 200% good luck
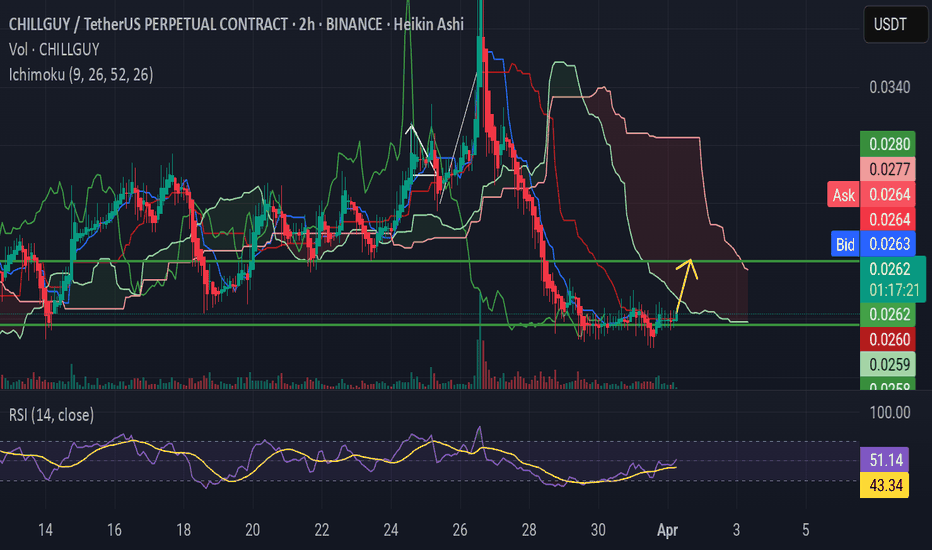
I see a possible increase to 0.028 over the next few days but target is around 0.05 Daily time frame RSI looks good So you can long until this target wait for the break and reztsti to enter to finam target
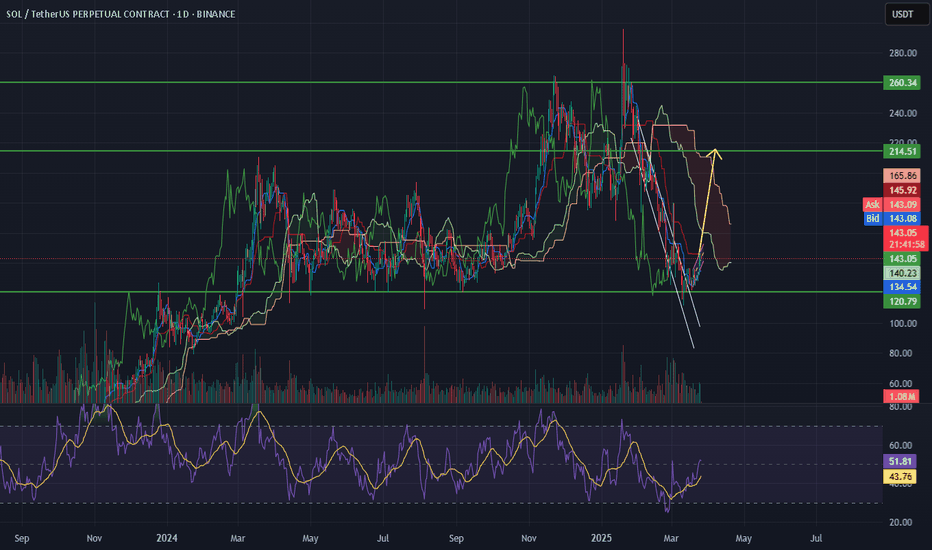
SOL retraced back to strong support, held well. so my sentiment have switched to bullish untill im infomed otherwise nice quick pofit with a tigh stop loss
Hi update on the weekly timeframe price had a reject you can see the wick therefore making the price pull back to support
High just updating another possibility hope it will. Help
You know previously looking at this chart I really believed chart looks mostly in bear mode however after changing if you trend lines and organising it further more I can see that we can have a push towards the resistance line that's above the price. you can see it's respecting the relative strength index signaling a potential upward movement which doesn't...
bullish divergence on RSI good momentum, price action looks +ive lets see


