AMEX:RUSS 21% Potential in Russian Bear! Entry now if you're a bit more aggressive or Entry after signs of higher highs and higher lows above blue EMA (15) line 2% Stop loss MacD showing signs of reversal RSI below 40
NYSE:WTI Minimum 14% Potential EMA (15) - Yes! SMA (180) - Yes! MacD - Yes! RSI - Yes! Obey a 1% Stop Loss, Buy at the next pullback, trail it :) Absolute no-brainer
Offers 15% potential between top and bottom drawn support and resistance If it makes higher highs past $3 then continue to be patient and wait for further higher highs and higher lows to confirm that it's on the uptrend before getting in for a swing trade On the weekly chart, IRI is in a down trend and is hitting the moving average line, so wait and see...
7% Potential 1-2% Stop Loss Repeatedly bounce between the support and resistence of this ascending parallel channel
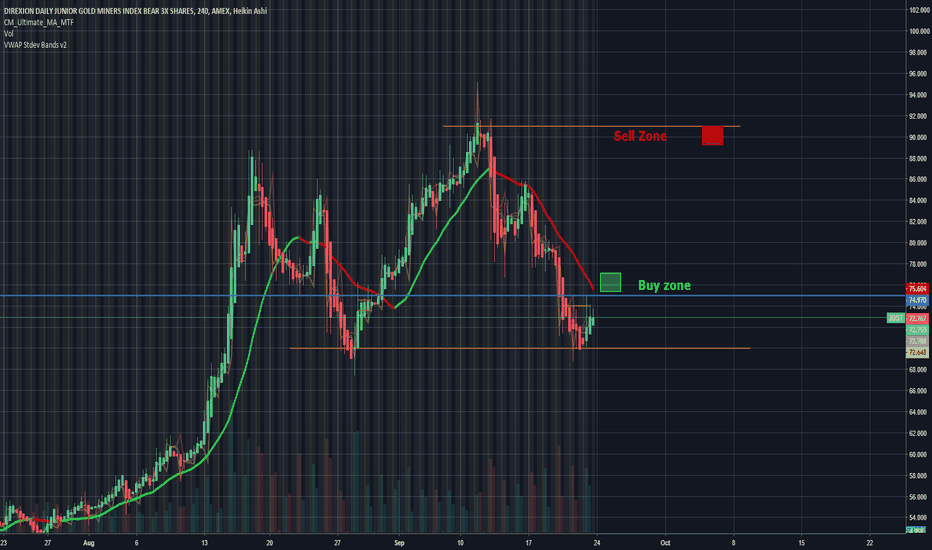
20% Potential Good Deal Zone Green light on MacD 3-5 Day Swing Trade Support/Resistence: 70 / 91 Entry/Sell: 75.5/ 84 Stop Loss: 74
JDST Day Trade Potential Long term it is also looking like it's about to reverse back up 20% over the few days.
JDST is in entry zone, for the more conservative traders, enter when it starts to confirm an uptrend when the candles start to appear above the MA on the 1 hour or 4 hour charts
I wouldn't touch Qantas until it starts confirming an up trend Which way do you want your money to grow? Up? Then trade a stock where the moving average is up. Moving average on Qantas is not point up, so don't buy yet.
Chris Moody's MacD indicator showing buy signal right now Squeeze Momentum showing it's in the good deal territory Candles are below the Chris Moody's MA As soon as you see 2 consecutive red candles on the 1 DAY Heikin Ashi chart for ASX:XJO, that's your stop loss, get out. ...otherwise I don't see why it can't hit 6300 even with one pullback.


