ZEUS_Market_Alerts
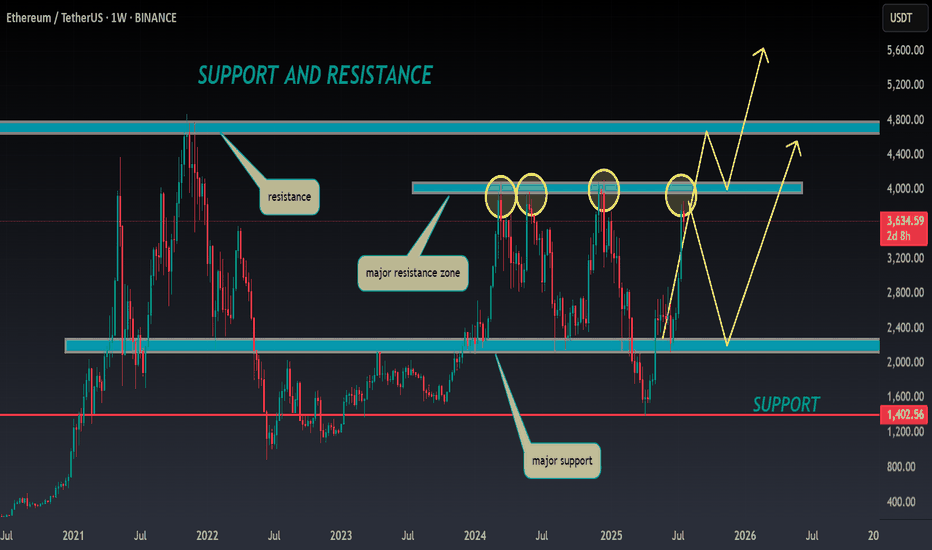
Premium🔮 #ETH Analysis 🚀🚀 💲💲 #ETH is trading between support and resistance area. There is a potential rejection again from its resistance zone and pullback from support zone. If #ETH breaks the major resistance zone then we would see a bullish move 💸Current Price -- $3634 ⁉️ What to do? - We have marked crucial levels in the chart . We can trade according to the...
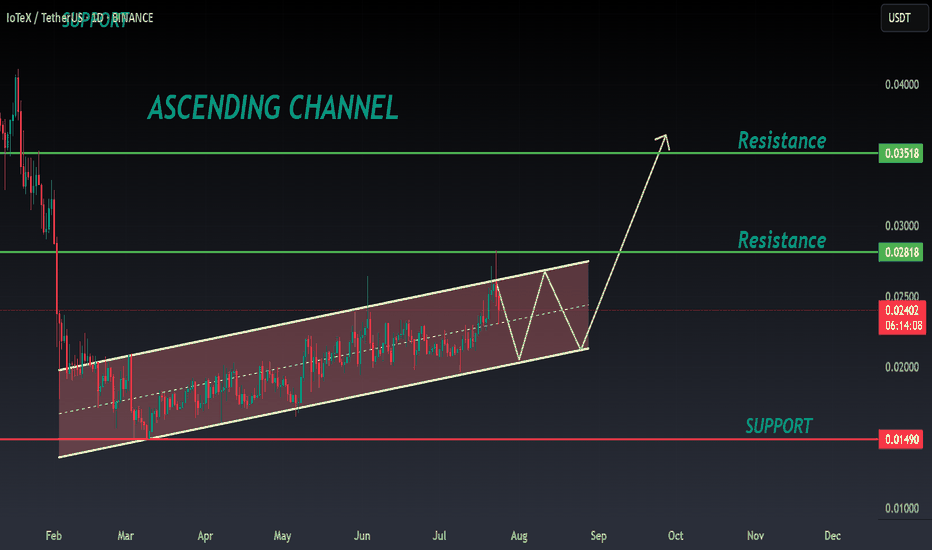
🔆#IOTX Analysis : Channel Following ⛔️⛔️ As we can see that #IOTX is following ascending channel on daily time frame. We can see a bullish formation here. And if it trade with good volume then we can see a proper bullish move in #IOTX 📈📈 🔖 Current Price: $0.02400 ⏳ Target Price: $0.03500 ⁉️ What to do? - Keep your eyes on the chart, observe trading volume and...
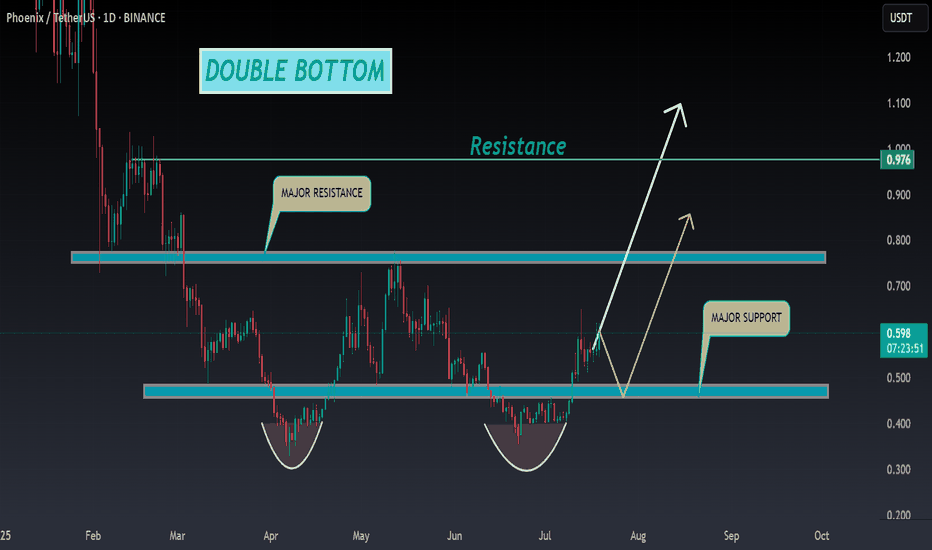
🔮#PHB Analysis : 📈📈 #PHB is making perfect Double Bottom Pattern. We can see a good pump if #PHB breakout the major resistance zone with good volume and sustains the higher price after breakout 🚀🚀 📊 Current Price: $0.595 ⏳ Target Price: $0.780 ⁉️ What to do? - We can trade according to the chart and make some profits in #PHB. Keep your eyes on the chart,...
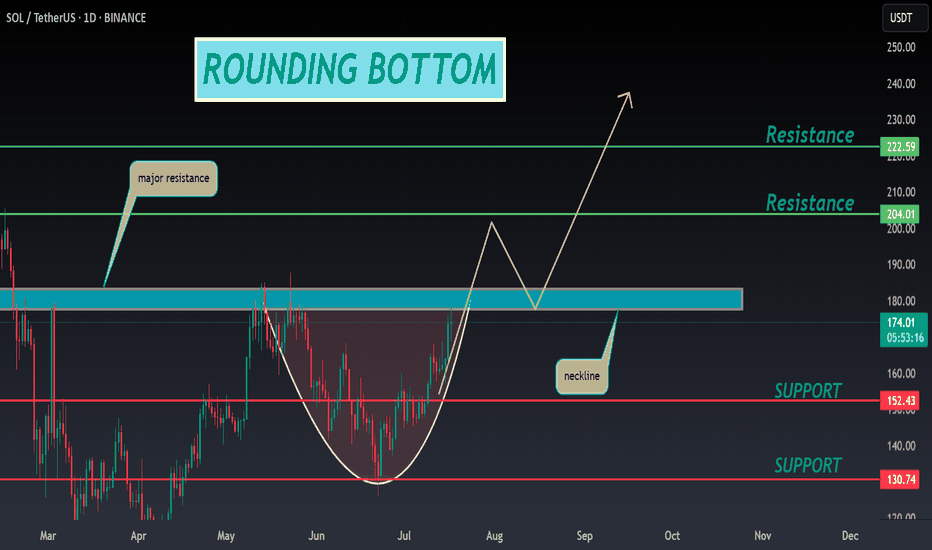
🔮 #SOL Analysis 💰💰 📊 #SOL is making perfect and huge rounding bottom pattern in daily time frame, indicating a potential bullish move. If #SOL retests little bit and breakout the pattern with high volume then we will get a bullish move📈 🔖 Current Price: $173.75 ⏳ Target Price: $204.00 ⁉️ What to do? - We have marked crucial levels in the chart . We can trade...
🔮 #CRV Analysis 💰💰 🌟🚀 As we can see that #CRV is trading in a symmetrical triangle and given a perfect breakout. But there is an instant resistance. If #CRV breaks the resistance 1 then we will see a good bullish move in few days . 🚀🚀 🔖 Current Price: $0.7280 ⏳ Target Price: $1.0800 #CRV #Cryptocurrency #DYOR
🚀#API3 Analysis : 🔮As we can see in the chart of #API3 that there is a formation of "Falling Wedge Pattern". In a daily timeframe #API3 broke out the pattern. Expecting a bullish move in few days if #API3 retest the levels ⚡️What to do ? 👀Keep an eye on #API3 price action. We can trade according to the chart and make some profits⚡️⚡️ #API3 #Cryptocurrency...
🔮 #1INCH Analysis 🚀🚀 💲💲 #1INCH was trading in a Descending Broadening Wedge Pattern, give a perfect breakout and will retests the levels. If the price of #1INCH sustains the breakout then we will see a bullish move. 📈📈 💸Current Price -- $0.2220 📈Target Price -- $0.2510 ⁉️ What to do? - We have marked crucial levels in the chart . We can trade according to...
🔮 #FLOKI Analysis 🚀🚀 💲💲 #FLOKI was trading in a Descending Broadening Wedge Pattern, and trying to breakout the pattern. Also there is a instant support zone and after the breakout of resistance zone we will see a bullish move. 📈📈 💸Current Price -- $0.00008540 📈Target Price -- $0.00009840 ⁉️ What to do? - We have marked crucial levels in the chart . We can...
🌸#BTC Analysis : Bullish Trend 🚀🚀 🚀As we can see that there is a formation of Flag & Pole Pattern in #BTC in daily time frame. Right now we can see that #BTC again retest from the resistance zone and we can see a bounce back from its support zone 💪 🔖 Current Price: $1,08,050 ⏳ Target Price: $1,20,000 ⁉️ What to do? - We can trade according to the #BTC chart...
📊 #ORDI Analysis ✅There is a formation of Descending Channel Pattern in daily time frame. After a breakout of the pattern we would see a bullish momentum and can Target for $9.5 in few weeks🧐 👀Current Price: $7.890 🎯 Target Price : $9.500 ⚡️What to do ? 👀Keep an eye on #ORDI price action and volume. We can trade according to the chart and make some...
🔮 #ETH Analysis 🚀🚀 💲💲 #ETH is trading between support and resistance area. There is a potential rejection again from its resistance zone and pullback from support zone. If #ETH closes above 2500$ then we would see a bullish move 💸Current Price -- $2,462 ⁉️ What to do? - We have marked crucial levels in the chart . We can trade according to the chart and make...
🔮 #WIF Analysis - Update 🚀🚀 💲 We can see that there is a formation of Falling Wedge Wedge Pattern in #WIF and we can see a bullish movement after a good breakout. Before that we would see a little retest and and then a bullish movement. 💸Current Price -- $0.848 📈Target Price -- $1.049 ⁉️ What to do? - We have marked crucial levels in the chart . We can trade...
🔮 #HYPER Analysis - Update 🚀🚀 💲 We can see that there is a formation of Falling Wedge Wedge Pattern in #HYPER and we can see a bullish movement after a good breakout. Before that we would see a little retest and and then a bullish movement. 💸Current Price -- $0.1087 📈Target Price -- $0.1358 ⁉️ What to do? - We have marked crucial levels in the chart . We can...
🔮 #XRP Analysis - Update 🚀🚀 💲 As we said earlier #XRP performed the same. Resistance1 achieved easily. Now we can see that there is a formation of Falling Wedge Wedge Pattern in #XRP and we can see a more retest before a bullish movement again. 💸Current Price -- $2.1729 📈Target Price -- $2.5964 ⁉️ What to do? - We have marked crucial levels in the chart . We...
🔆#BCH Analysis : Channel Following ⛔️⛔️ As we can see that #BCH is following ascending channel on daily time frame. Also there is an instant resistance area. We can see a bullish formation here. And if it trade with good volume then we can see a proper bullish move in #BCH 🔖 Current Price: $463 ⏳ Target Price: $598 ⁉️ What to do? - Keep your eyes on the...
📊 #ETH Analysis : Update ✅As we said earlier, #ETH performed same. Now we can see that #ETH is trading in a bullish flag pattern and its a bullish pattern. We could expect around 10% bullish move if it sustain above its major support. 👀Current Price: $2555 🚀 Target Price: $2815 ⚡️What to do ? 👀Keep an eye on #ETH price action and volume. We can trade...
📊 #TURBO Analysis ✅There is a formation of Falling Wedge Pattern on daily chart and currently pullback around its major support zone🧐 Pattern signals potential bullish movement incoming after sustain above the major support zone and breaks the pattern with good volume 👀Current Price: $0.004050 🚀 Target Price: $0.004470 ⚡️What to do ? 👀Keep an eye on...
🔮 #AAVE Analysis 💰💰 📊 #AAVE is making perfect and huge rounding bottom pattern in daily time frame, indicating a potential bullish move. If #AAVE retests little bit and breakout the pattern with high volume then we will get a bullish move📈 🔖 Current Price: $248 ⏳ Target Price: $348 ⁉️ What to do? - We have marked crucial levels in the chart . We can trade...


