ZakGire
ETC was trading below the 50 SMMA. however as you can see the circled it met with plenty of resistence and it has broken down from here. currentl ETC is trading below the 20 EMA and until we dont see a breakout from here we could go down further.
you can easily see that ETC is breaking down facing major resistance above
TRX has formed a bull pennant on the 4 hour chart. we could see a potential breakout very soon. yesterday i posted this as a Bull flag. put as the trade develops it looks more like a pennant. the next resistance will be the 1049 mark just above. with current market conditions we are not sure as to what kind of break out we will have and whether the breakout will...
we should have some consolidation after the breakout. and price should carry on moving up
Each Rally has failed. the bears seem to be taking over. and we should see a drop in TRX price. there seems to be alot of overhead resistance at 852 when previously this was support. the MMA 20 could also be seen as a resistance line. the price has rallied above it on three occasions.failing two times. we can currently see the third taking place now.
as you can see TRX fell from the rising wedge (grey lines). The MMA 20 line was a resistance which TRX has broken through. personally i think we need to get to the black trendline to get a massive breakout. i alredy have some TRX so i wont be buying anymore. personally with the current situation in the market id avoid going long on any coin. there is a...
Hi Guys, please take a look at my updated ETCBTC idea
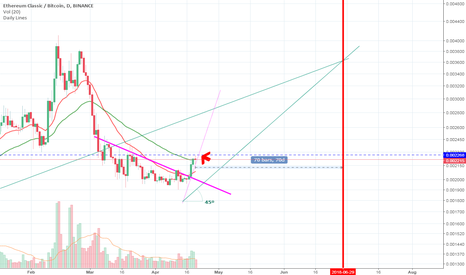
if we stay above the black trendline we should see a breakout as we did on 01/02/18. this is just some basic ideas and not a buy/sell signal
ETCBTC broken out out of the downtrend as can be seen above. hopefully the uptrend will carry on if it breaks through some of the inital resistance. current trajectory is higher then expceted but next 70 days should show a high of 0.36+ this is just what i think and not buy signals
Hi Guys! this is my first attempt at Elliot wave analysis. i think we are on the correction stage of the waves. the first impulse wave is complete. i would like to see some comments on how you found my ETC Elliot wave analysis. Remember guys there is going to be a hard fork very soon. which means the price of ETC can moon! like i said this is just my analysis and...
Taking on the comments from my previous posts i have posted an updated version of the ETCBTC Chart. this time i have added in Fib Retracement. Again would appreciate any comments and ways i can adjust my analysis. by my analysis i think we should be hitting the 5th wave now.however these waves can tend to be risky and fail. we should see some more correction...
This is my first analysis. so far as i can see is that Elliot Wave 1 (impulse wave) is now complete and therefore we should see an correction before the up trend carries on. i would like to see some comments on the elliot wave i have plotted to verify its accuracy. Thank you


