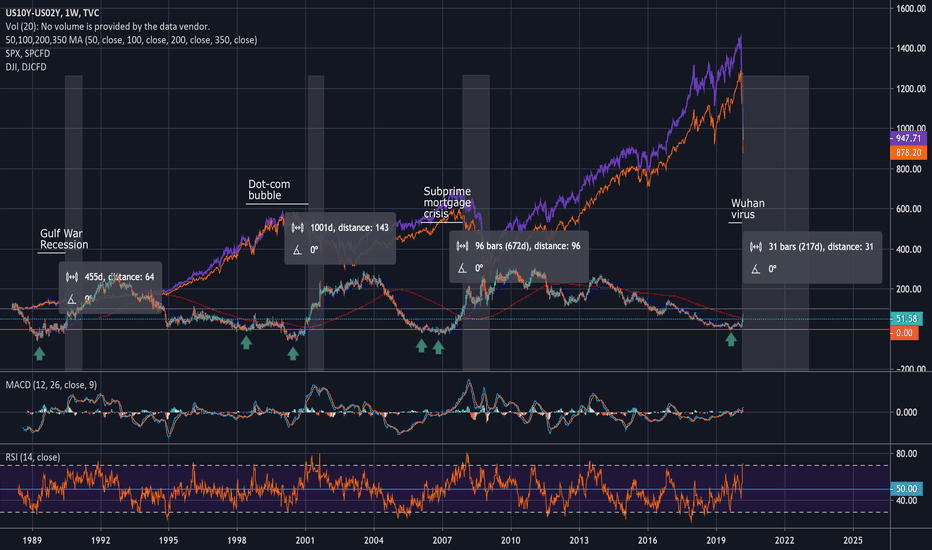
US 2-Yr and 5-Yr Yields hit record low as futures investors anticipate negative rates. www.ft.com Who is right? The bond market or stock market?
The Industrial Production Index (IPI) is an economic indicator published by the Federal Reserve Board of the United States that measures the real production output of manufacturing, mining, and utilities. Production indexes are computed mainly as fisher indexes with the weights based on annual estimates of value added. Since Fisher indexes only preserve growth...
Okay this is completely speculative here because the market has been super irrational and stocks like $ZM has magnified swings. But here's a possible scenario.
- A H&S is almost complete - Do note that the right shoulder is slightly higher than the left shoulder - The right bottom is higher than the left bottom, which forms an up-tilting neckline - Could these be interpreted as bullish bias? - Volume is in an overall downtrend - Muddy Waters Research published a report on $TAL. You can download the report here:...
Upper resistance and lower support are both tested two times. Which side will the breakout be on?
Green arrows pointing at instances where the Yield Curve is Inverted. Info line shows how many days are in between the yield curve inversion and the beginning of a recession. As you can see, the yield curve inverted again in Aug 2019.
Pole of the flag forming at $191.92, breakout point at $203.94. Conservative price target: $208.91 Optimistic price target: $219.92


