A nice big W with a forming handle. This is a classic one and usually confirms an upward trend.
As we can see the ascending triangle pattern lead to a volume contraction, which pretty much indicates accumulation and buying pressure. With more or less equal highs and higher high lows, we'll be witnessing an upward breakout, for sure. TP: 0.17 SL: 0.134 Like & Follow for more tech analysis!
Potential double tops formation folks... we may see one final bull rally for LTC before it falls into the abyss and plummets like no tomorrow. Stay Tuned.
We might see a cup-and handle pattern forming during the upcoming days if the price reaches the resistance line at fib 0.382 and breaks out. It's been a long congestion phase for DGB, mainly because of selling pressure that made the price consolidate toward a downtrend... but rest assured folks, by the end of this week we might see an increase when DBG begins to...
Here we have a symmetrical triangle that is preceded by an upward trend, and as such the price will continue to move between the trendlines until breakout. Expecting a breakout during the next week... Although, at this point, the eventual breakout direction does not need to be predicted. As such, EP should be executed when the price moves beyond the bounds of...
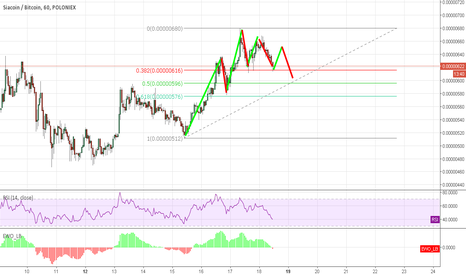
We're already at four trending waves up and 2 counter-trend waves down. Im expecting a formation of a complete eight-wave bull market pattern. 3rd counter-trend wave begins @ 616 up to mid 630's low 640's. Any thoughts ?
Fibonnaci retracement levels 0.618, 0.5 and 0.382 are clustering between 606-616 satoshis forming a strong area of support with RSI trickling @ 40, which shows that its near of being oversold. If it breaks this support (which I doubt), we might see it drop at 593-596 before it boosts up. Like & Follow me for more in-depth technical analysis :)


