ahmadreza94
Here is the monthly chart of the bitcoin. Based on price action analysis, we have a broad bull channel. We can see 2 price action signs here: 1- Second leg in the bull channel, we call it second leg trap 2- A climactic move to the top of the channel (biggest bull bar late in the trend) Given the context, there is 60% chance that we see the bottom of the climactic...
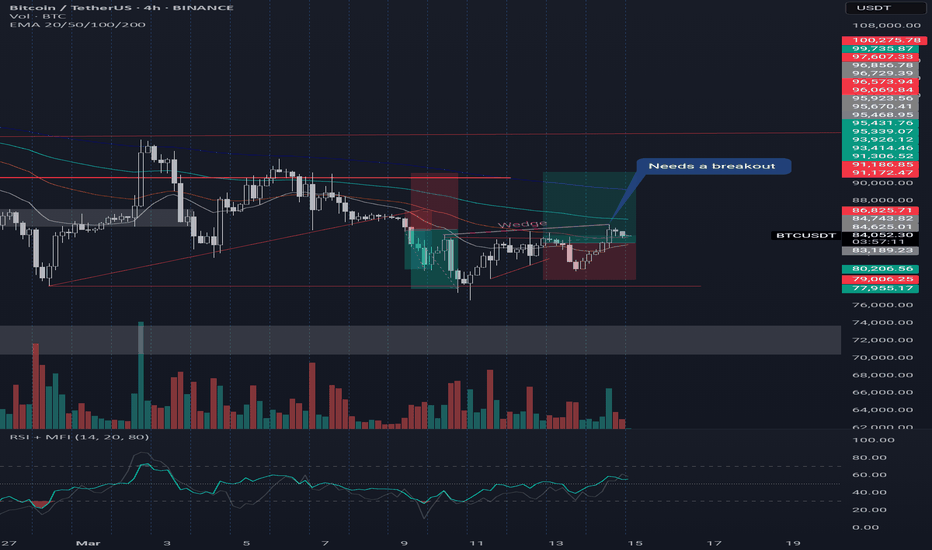
We see a wedge on the bottom of the bear leg, probably an exhaustion gap.
The same break point of the previous move, which has become a resistance. However, a decision point!
I opened a more risky trade (With lower volume for these kinds of trades). I think I got a lesson.
BTC can make a v climax pattern to the top of the breaking point which is also the top of the channel
Solana has the potential for a second leg down. It can get close to it's Moving Average again
Head and shoulder bottom, can make a cup and handle pattern
If the last candle closes in a bearish breakout, %70 chance for a second leg down, if reverse, back to the previous high
If the last 4h candle closes like a bearish breakout, 40% of a MTR.
XRP can does a second leg breakout to $3.5. Timeframe 4 hr
Trumpsole - Looking for a reversal pattern, bull breakout. Timeframe: 1h
Jupiter/usdt - it maybe fail within 3 candles. Megaphone pattern, Expanding triangle. Waite for the final flag pattern, it can be a triangle Time frame: 4h
Based on ICT concepts, price has made a liquidity in the bottom of the pattern, I think price gonna hunt this liquidity and goes up to fill those FVGs and then comeback to continue its movement
Next week anticipation. I think, based on ICT concept and checking weekly, daily & 30mins timeframes, there is a liquidity in the bottom of the pattern. So I think next week price gonna hunt this liquidity and goes up to fill those FVGs and then come back to continue its move


