Hello, All the indications are on the chart. Best regards, Alexandre Simões
Ascending triangle on the daily LTCEUR. Green 2 went above a green 1 on the TD Sequential. If the breakout happens, the target is around 34. The 100 day may also be relevant at around 36. At this exact moment the 1 hour is correcting a bit. The best entry point is probably at 28,50. I would put the stop at 27,50. Best regards, Alexandre Simões
Hello, We are closing in on the 50 Month moving average. It supported the price twice in history. We never had a candle close below it. The RSI is at the lowest level in history. The way I see it, we have to get a bit under the 50 Month, maybe get a red 9 on the weekly (we are closing with a red 5 this week), and then bounce strongly. If we don't.. there isn't...
Hello, Descending triangle on the 4h. Target around 2750. Best regards, Alexandre Simões
Hello, A descending channel seem to be forming on the daily. I just drawed some previous resistence and support points, dating from August 2017, intersecting the channel. I'm watching those carefuly for a possible bounce. #Keeping it simple. Best regards, Alexandre Simões
Hello, The green 1 on the TD sequential setup phase looked promising when it went above the green 9, indicating that we could accelerate the 13 countdown phase to the upside. Unfortunately, this candle was also a perfect gravestone doji. Candle shape overrides TD sequential. We are still above the cloud, however, the baseline of the ichimoku crossed the...
Hello, We are above the cloud with the conversion line above the base line and we have a green 1 on the TD sequential setup phase. The RSI is getting close to overbought but wee still have some room to go up. We are set to go to the 200h MA, around 3700, in the next 9 hours. After that we will probably have a correction. Best regards, Alexandre Simões
Hello, The descendig triangle target has pretty much been reached. The 200 week MA seems to be supporting the price. The RSI is touching the oversold condition. I would not be surprised with a relief rally into the 128 week MA, around 5k, before resuming the drop. Best regards, Alexandre Simões
Hello, Cup and handle on LTCEUR daily chart. RSI is trending up. TD Sequential is on a green 4 of the 9 setup phase. It's a bullish scenario but i would wait for the confirmation of the breakout close to 32 eur. Best regards, Alexandre Simões
Hello, Ascending triangle on the daily. If we get the breakout, the statistic target is around 5k. Best regards, Alexandre Simões
Hello, BTCUSD is going to hit a red 9 on the sequential (next candle), meaning inversion. The red 8 candle is forming a dragonfly doji, meaning inversion. The RSI is at all time low's. It will probably go up at this point. Note: My long term analysis is bearish. This is a daily analysis. In the long term i think we are going lower than we are now. Best...
Hello, Everything seems to point to a drop to around 5k in the next month. 1 - The price is getting to the tip of the descending triangle. 2 - 3 going below a 2 on the setup phase of TD Sequential. 3 - The last fibonacci line is around 5k. 4 - The 30 day MA is approaching 5k. 5 - Strong support (previous resistence) on the 5k area. Best regards, Alexandre Simões
Hello guys, Just a quick update to analise de TD sequential on the daily. We are having a green 13 on the countdown. Notice what happened in the last two 13's. Best regards, Alexandre Simões
Hello, The 128 day MA has been resistance since mid september and is now coinciding with the base of the "small" ascending triangle. It BTC breaks this point, it might have a breakout until the 200 day MA, wich coincides with the expected triangle breakout increase. On the TD sequential, a green 4 went above a green 3, indicating the top of the green 3 candle as...
Hello, On EOS daily chart the price is wanting to break out of the symmetrical triangle. On the TD sequential we should enter a trade if a green 2 is above a green 1. That's will happen if the price goes above $5,91. Due to the current BTC situation i would put a stop on break even level as soon as the trade start's to make money. Then ajust if it continues going...
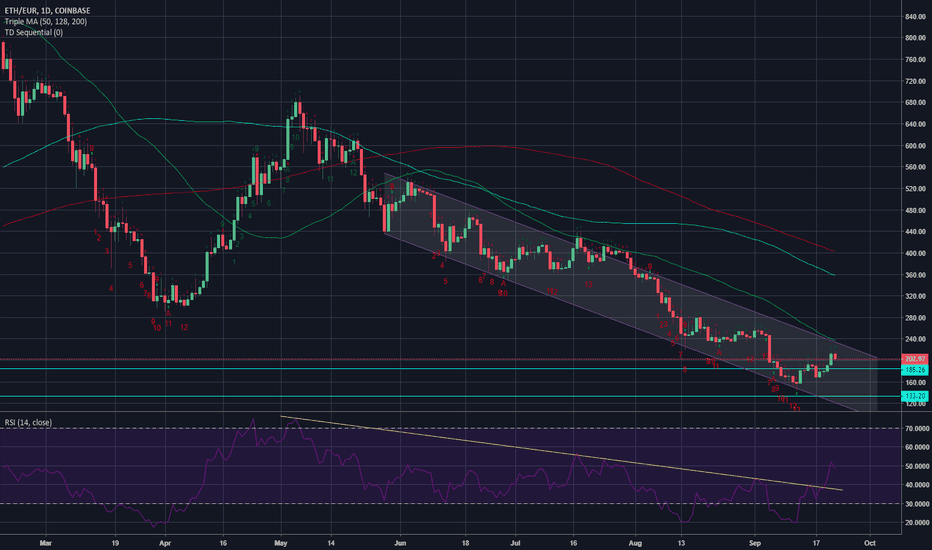
Hello, ETHEUR is in a downward channel. I draw this channel from early June but one might argue that it should be drawn from the top of May. Either way the long trend is down. In my chart the channel was broken in late July, early August and was pushed back down into the channel by the 50 day MA. September 12, on the sequential, we had a beatiful red 8 that...
In the weekly BTCUSD chart we have a huge descending triangle that is near to its disclosure. According to the technical analysis of the chart, if the outcome is typical, the price should reach a value around 3k dol. This price corresponds, coincidentally, with a very strong resistance point, which will probably become support. This price of 3k dol, would most...


