alexpv73
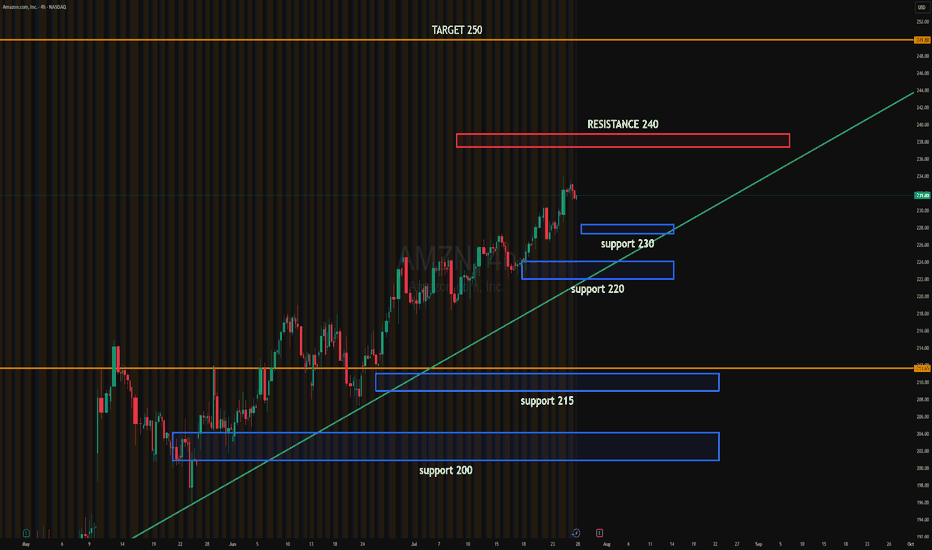
PremiumAMZN price action update: Price is consolidating below the 240 resistance after a steady climb. Buyers are defending the 230 level, showing signs of absorption just above the ascending trendline. The 233.50 breakout level could trigger momentum towards the 240 resistance. If breached, institutional targets extend toward 250. Current consolidation suggests the...
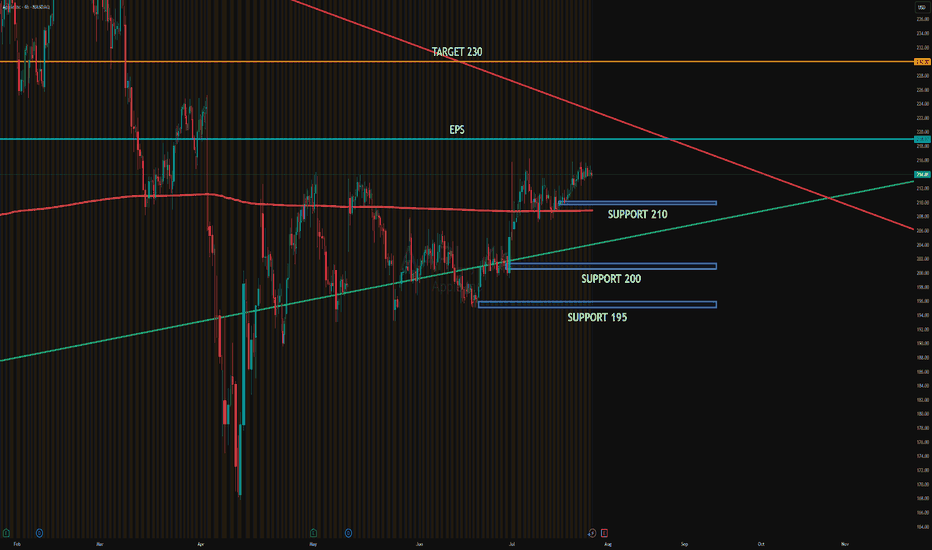
AAPL is consolidating just below the post-EPS resistance zone near 219, while institutions are actively defending support around 210. There's visible absorption at 210 and 205, aligning with high PUT interest, suggesting a strong institutional floor. Distribution is evident in the 220–225 area, where CALLs are being sold to cap upside and benefit from theta...
HOOD is holding the 100 support zone after a high-volume sell zone near 114 from a $3.2B unload. Market makers defended the 100 level with PUT selling, suggesting institutional absorption. Price is consolidating above trendline support and may trigger a gamma squeeze if it breaks above 106 with volume. Upside target: 140 Downside target: 100, then 85–80 if...
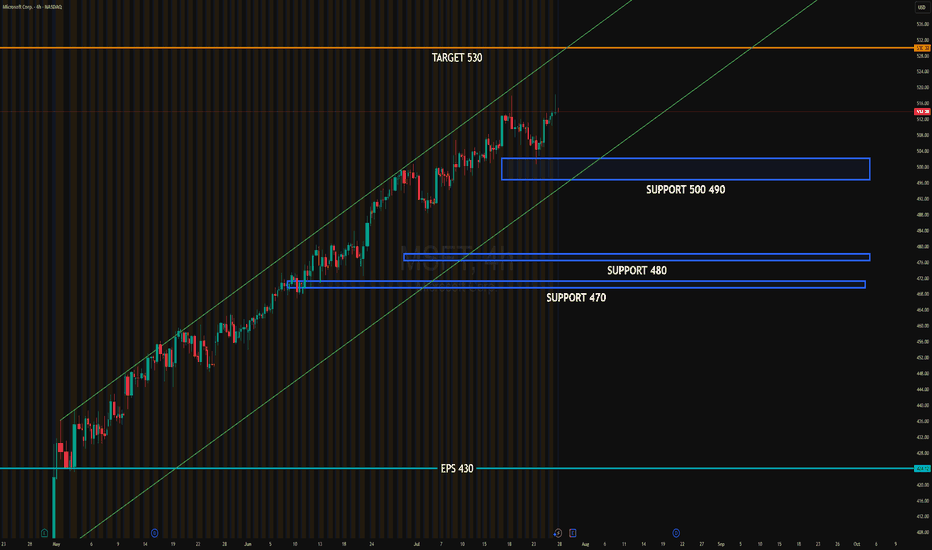
Microsoft (MSFT) is consolidating near the upper edge of its ascending channel, with strong institutional defense between 490–500. The 510–520 range shows absorption and may trigger a directional breakout. A close above 515 could ignite momentum toward 530. Upside target: 530 Downside target: 490 (support) then 480 #MSFT #globaltrade #investment #investing...
META is consolidating below resistance at 720, with visible absorption just under 710. Institutional activity shows active PUT selling at 700 and directional BUY CALLs around 715–720. This suggests accumulation and potential upside pressure. If price closes above 715 this week, a breakout toward 725–730 becomes likely, especially ahead of earnings. Support...
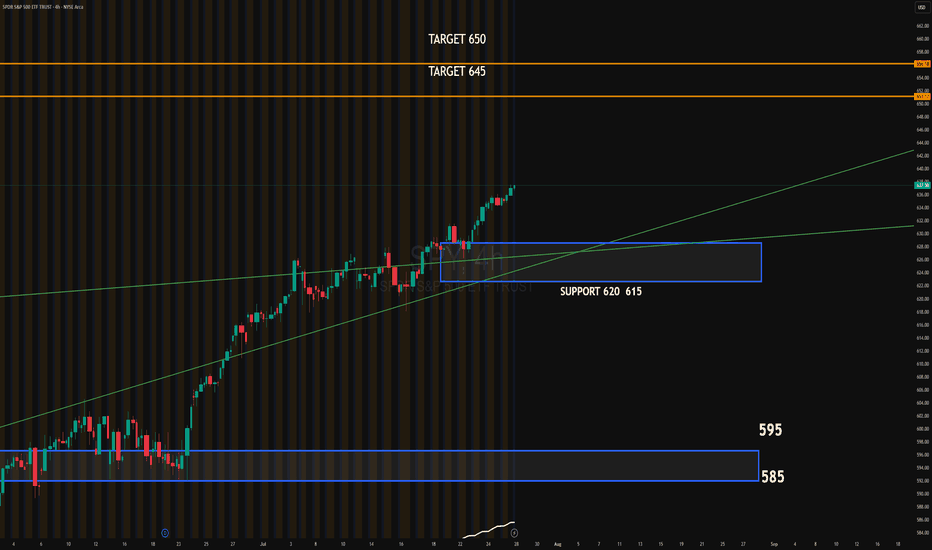
SPY continues its bullish trend after breaking above the ascending channel. The recent breakout shows strong momentum, supported by institutional absorption around the 620–615 zone. This area now acts as key support. Upside target: 645 Extended target: 650 Downside target if momentum fails: 620–615 zone, followed by 595 #SPY #globaltrade #investment...
RESISTANCE: $78.50 – $79.50 → Current supply zone capping upside SUPPORT ZONES: $73.00 – $74.00 → Immediate support $69.50 – $71.00 → Critical zone to hold structure GAP TARGET: $85.00 → Upside potential if earnings surprise Trendline: Strong bullish trend since May, still intact
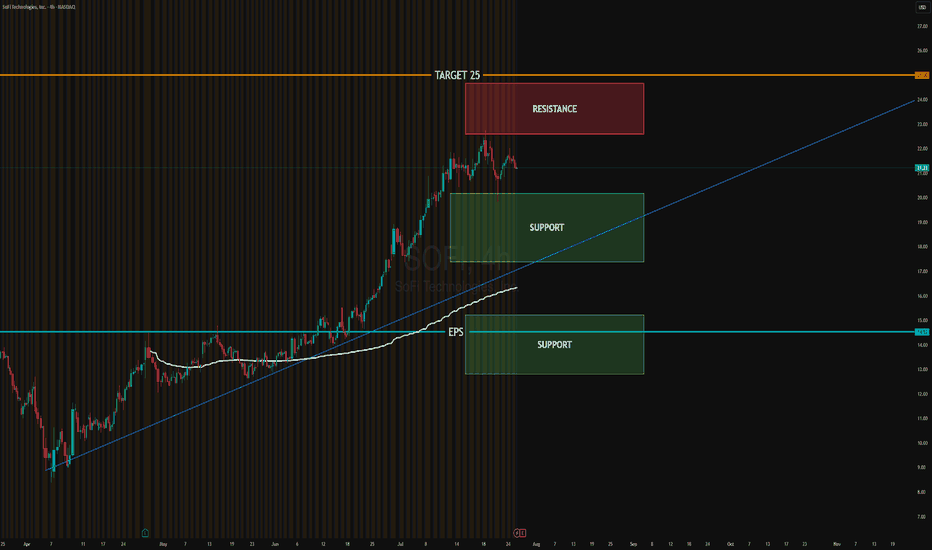
Resistance Zone: $22.50 – $24.00 Support Zone 1: $18.00 – $19.50 Support Zone 2 / EPS Breakout Line: $14.50 Bullish Target: $25.00 Trendline: Still intact — medium-term trend remains bullish
Tesla broke below the triangle formation, signaling a bearish continuation. Trend: Bearish breakdown from consolidation triangle. Key Support (SUP): $300 (now resistance on retest). Next Demand Zone: Strong block between $284–285. Accumulation Zone: $250–220, identified for potential long-term institutional accumulation. Resistance (RES): $300–350 remains a...
NASDAQ:NVDA SUP: 157 | RES: 159.7 – Triangle forming. NASDAQ:AMZN SUP: 220 | RES: 224 – Compression zone. NASDAQ:META SUP: 700 | RES: 739 – Needs reclaim to recover. NASDAQ:NFLX SUP: 1279 | RES: 1302 – Bullish dip hold. #trading #stocks #technicalanalysis #optionsflow #NVDA #AMZN #META #NFLX
Resistance: 630 – Strong supply zone, potential profit-taking area. Support Zone: Around 617 – Recently tested, holding as short-term support. Gap: 615.03 → If SPY loses 617, watch for a retracement to fill the gap toward 615. Major 4H Support: 610.17 – Institutional block. Losing this level would break the short-term bullish structure.
Strongest bullish setups: NVDA, AMZN, TSLA Watch for pullbacks: META (risk of lower lows), NFLX (overextended) Key upside targets: AAPL: $221 NVDA: $199 AMZN: $225 TSLA: $764 GOOGL: $190 MSFT: $450 Support zones to hold: META ($500), AAPL ($200), TSLA ($720)
Trend: Strong bullish continuation. Price just broke above the key 610 level, entering a momentum phase toward the projected 650 target. Structure: SPY is trading inside a rising channel. The upper bound aligns with the 650 level, suggesting this is the next liquidity zone. Support Zones: 610: Now a critical support. If it holds, buyers remain in...
SPY (4H) Trend: Bullish Current price: 604.32 Active resistance block: 604.33 Channel: Rising, intact Key support: 581.99 📈 Break above 604.33 could trigger fast move toward 610+ 🔹 QQQ (4H) Price: 536.25 Resistance: 536.45 Support: 509.95 Volume: Building under resistance 📊 Breakout expected if 537 is cleared with volume 🔹 VIX (4H) Level: 13.89 Trend:...
Long from $125 or $105 with confirmation. 📤 Short if $125 breaks and no absorption is seen. Key resistance: $150 / $165 Key support: $125 / $105
Institutional Swing Analysis – Jun 21, 2025 📈 AAPL Trend: Reversal attempt in downtrend Buy Zones (CALLs): 196 (accumulation) Sell Zones (PUTs): 199 (distribution) Support Block: — Resistance: 201 → 204 → 206 Scenario: Above 200 = continuation to 204–206. Below 198 = back to 195–194. 📈 NVDA Trend: Consolidating at resistance Buy Zones: 142.5 Gap Support:...
