aliaezaaz
Price action and RSI breakout already happened. Price stability suggest that its ready for the next leg up. Its weekend, low volume, Trade at your on risk. NFA Manage your Risk
🟠 SUI/USDT – Short Setup (45min) Double Top formed near $2.22–$2.25 resistance zone. Rejection with overbought signals (93) – bearish divergence likely. Price testing 50 EMA – break below = short confirmation. Entry: Below $2.16 SL: Above $2.25 TPs: $2.06 / $2.00 Bearish bias unless price breaks and holds above resistance. #SUI #Crypto #ShortSetup #TradingView
RISKY DUE BINANCE MONITORING TAG 📊 Technical Breakdown 📉 Pattern: Falling Channel The price has been moving inside a descending channel, which often acts as a bullish continuation or reversal pattern. A breakout above the upper trendline of the channel has been marked as the entry point, signaling a potential reversal of the downtrend. 💵 Entry Level Marked at:...
🟢 GAS/USDT – Long Setup (45min) Price forming higher low near $3.00 support Potential reversal from consolidation zone Entry: At CMP ($3.09) SL: Below $2.99 TP: $3.35 Clean risk-to-reward setup – watching for continuation.
Wait dor the daily closure to print bearish candle with 93 score, if its printed the same way, we will se a short to mid term rally in ALTS. NOT ALL ALT COUNS GONNA RALLY Choose wisely NFA DYOR
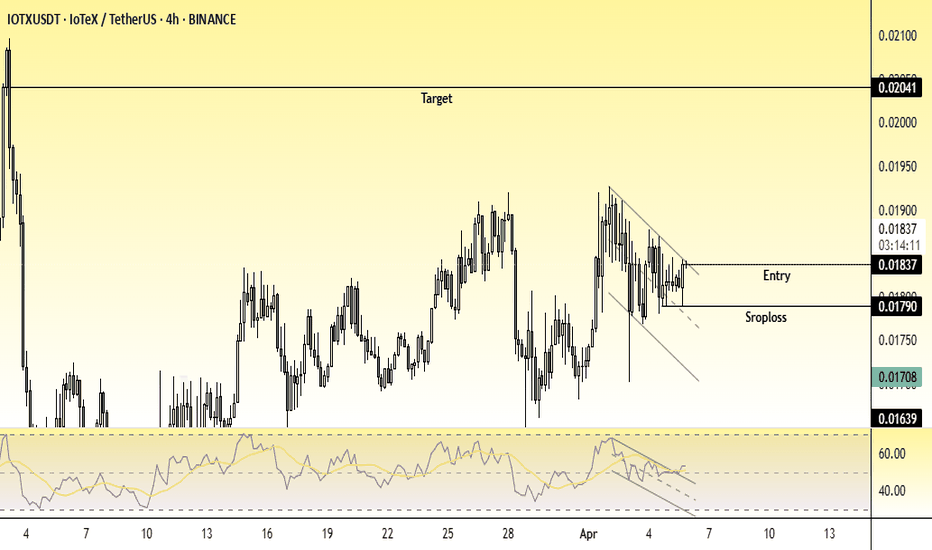
📊 Technical Breakdown 📈 Pattern: Falling Wedge (Bullish Reversal) The price broke out of a falling wedge, a bullish reversal pattern. Wedge breakout occurred with a slight increase in volume and RSI confirmation, indicating momentum shifting towards bulls. 💵 Entry Level Marked near 0.01838 USDT, right at the breakout level from the wedge. 🎯 Target (Take...
Breakout Confirmation: Bullish Reversal Potential 🚀 Entry: Enter at 0.003435 on a confirmed retest of the breakout level, where price has decisively moved above the channel’s upper boundary. 🎯 Target: Aim for a resistance zone around 0.003540 as the next profit-taking area. 🛑 Stop Loss: Place your stop loss at 0.003380—just below the recent swing lows—to...
Price is currently moving in a falling channel which RSI has broke out. Buy signal has printed in 2 hour time frame. A good long opportunity to target channel high in short term. Manage your risk and always use stoploss.
The chart is self explanatory.. The next candle will conform the short term trend. Place your entries in ALTS having RSI breakout or divergence i:e WIFUSDT Manage your risk. Not a Financial Advice
🔻 Descending Channel: Price remains in a short-term downtrend but is testing strong support near the channel’s lower boundary. 🏹 Long Setup: Entry: CURRENT MARKET MARKET Stop Loss (SL): Below 0.066 (recent swing low) Take Profit (TP): TP1: 0.0001657 TP2: 0.0001989 📈 RSI Breakout: RSI is emerging from oversold territory, and trendline suggesting potential...
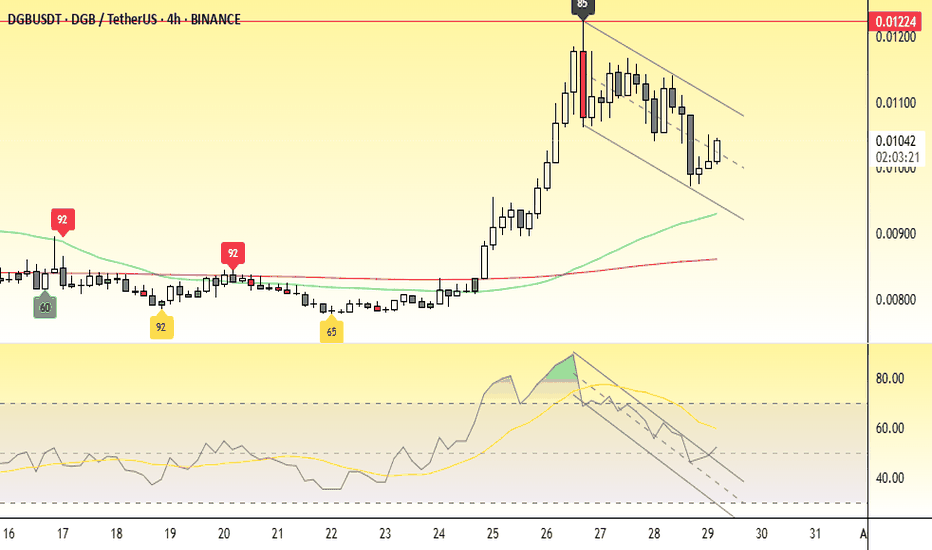
Price is currently at potential zone with algorithm printed 92% probability for long. Targets and stoploss are mentioned. Manage your risk
Trend & Structure Price appears to be forming higher lows (as shown by the ascending trendline). The 50 EMA (red line) is now below the price, suggesting a potential shift in momentum. 92 % Probability signal indicating bullish momentum building up. Key Levels Support: Around the ascending trendline near 0.54–0.56. Resistance: Notable resistance levels...
Market Structure The probability algorithm has printed 92% Long Probability the Chart coupled with RSI and trend breakout. Price has been moving in a downward channel, indicating a longer‑term downtrend. However, there may be signs of a potential base forming near the lower boundary of the channel. The recent price action around the 0.30–0.31 region could be...
Price is at 1 hour support zone, Take profit targets and stoploss is mentioned Manage your Risk Always use Stoploss 🛑
📌 Market Overview: The price experienced a strong bullish rally, followed by a sharp decline. Currently trading near 0.0001587, forming a small consolidation after a strong sell-off. Potential support zone around 0.0001500 - 0.0001550, which may act as a demand area. The price is trying to stabilize after a correction from the peak. 📈 Trade Plan: Long Position...
Pattern & Market Structure The chart shows an uptrend with a bullish flag pattern forming, which typically signals continuation of the uptrend. A breakout from the flag pattern is expected, leading to further upside movement. Entry & Confirmation Entry: A breakout above 0.00006767 (previous resistance) confirms bullish momentum. Confirmation: A 4H candle...
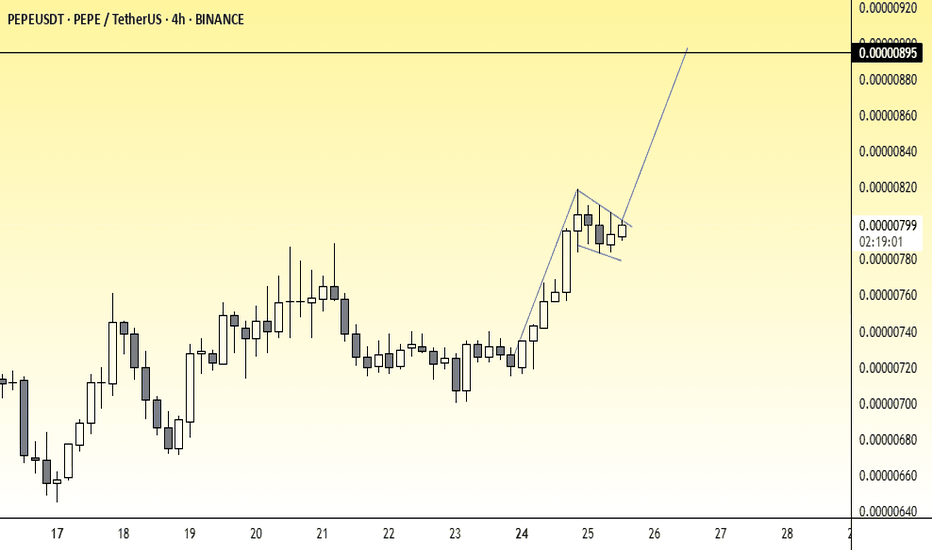
Market Structure & Pattern The chart shows a strong uptrend, followed by a bullish flag pattern, which is a continuation pattern. The price is consolidating in a tight range, preparing for a breakout. Buy Entry & Confirmation Entry: A confirmed breakout above 0.00000800 with strong volume. Confirmation: A 4H candle closing above this level signals a buy...
📌 Market Overview: The price has been in a downtrend, forming a descending channel. Currently trading near 9.20, with 10.00 acting as a key resistance. A bullish breakout from the descending channel appears to be forming. RSI breakout above trendline resistance suggests increasing bullish momentum. 📈 Trade Plan: Long Position (BUY Setup) Entry: At Current Market...


