almarouf
I never missed a chart - I’m shorting BTC since 24,580 on 25x leverage, I got till now almost 400%. We might see last pump before the big dump as a hidden divergence is forming at the moment on RSI. If you followed my first call then I would suggest to keep the short. If not, then wait for the 12K because we might go for the big pumpy humppy!!!
My short entrance began in $24,585 and I'm not going to leave until I got x7 of my trade. It's not the time for entry, so you have to be careful with your trades. Big Swings might occur before the dump. My SL: $24,650 Negative Divergence on RSI and MACD on daily chart.
So according the the given chart, we are moving down to retest 17K and then move down to 12K. According to the following: Hidden Negative Divergence on RSI Negative Divergence on Volume Bearish Flag Thanks for following up and Good luck
If it is Bearish Pennant we will be moving to 12-15 K, or if a positive divergence formed on RSI on DAILY chart, then we shall start the next pump move. What do you think?
What do you think of this wave on 4 HR chart? Do you think we going short now?
BTC is going long as We can see a formation on 1H Chart - SL: 28,600
I can see negative divergence on 4H Chart and the bearish pennant formed in the chart…
BINANCE:BTCUSDT Are we going to see a sharp fall after the weekly analysis which showing cup and handle?
We can see the patterns how they are shaped now, let’s what will happen next
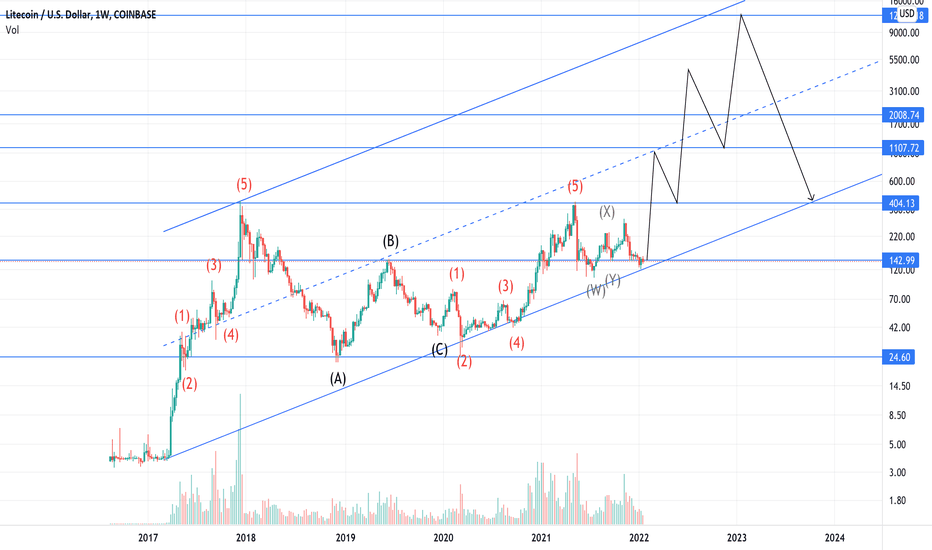
As BTC is still in short movement I’m waiting for the end of the correction movement to go for LTC.
I've never seen such a chart in cryptocurrency that respects its uptrend to this extent, if LTC didn't break the trend and keeps it upward move, I can see a potential return within at least 12 months of 10 - 90X.
Right now BTC is forming a bullish falling wedge moving upward to 50-60K, but we need to see the bigger picture, which is; there is a huge gap in 2020 bullish run and what prices came till now, the gap here refers to the consolidation area, each bull run there is a consolidation area that shall take support, the market maker didn’t want to make it happen in May...
As you can see we are in the fourth wave, and we are moving towards the strongest support area 38-28K, expecting to form a head and shoulders before the dump. This is not a financial advise.
If price didn’t breakout 59K, a slight dump might occur, moving down towards 54-55K
On hourly chart, negative cup and holder showing on the chart, which means there is a chance to move down to support $16-$15
As you can see an inverted cup is showing on the chart, which indicates a drop to the base $2.


