Followers
1
Following
1
Ideas
2
Scripts
0
since May 14, 2019
chartpattern
trendanalysis
Less Tags
Show All Tags
All Types
Type
All Types
Indicators
Strategies
Libraries
All Accesses
Script access
All Accesses
Open
Protected
Invite-only
Public & Private
Privacy
Public & Private
Public
Private
TCS is trading in a channel and is near its short term support. The targets and sl will be: T1: 2120 T2: 2150 T3: 2200+ T4: 2300+ Sl: 2040 Time frame for the 1st two targets are short whereas last 2 targets can take 1-2 months to reach. Long term chart movement shows that TCS is a BUY call
1
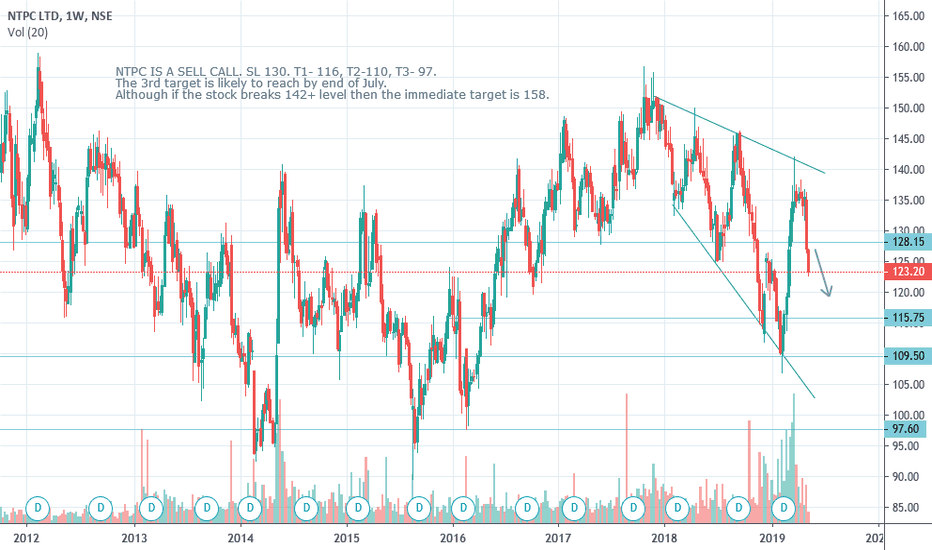
The formation of NTPC chart suggests that the stock is going to move downwards in a short term basis. We could see the following targets as suggested in the stock in 1-4 months. The third target of rupees 97 will be achieved by the end of July or August.
0
Type
Script access
Privacy


