amjad36
Price hit daily Trend line Price broken 4H up trend and re-tested It seems a double top also (increase TP if neckline broken and re-tested R/R = 1:2
This is my trade journal and not a trade advice I have longed GJ Reason. Price broken Monthly downtrend (Red) and now it seems a retest. Price hit Daily channel up trend line(blue) Area seems to be strong support zone (dotted line) TP : 149.200 SL: 142.244 R/R = 1/2.78 Please criticize
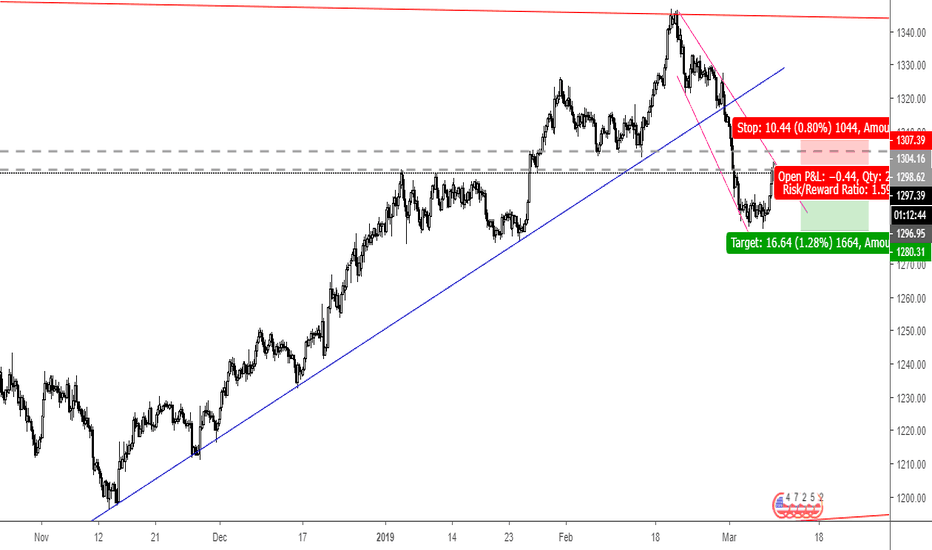
This is my Trade journal , not a trade advice for anyone . Please consider your own method for analysis. I have shorted Gold at 1297 Reason. Trend changed from monthly Trend line (Red) now it is down trend. Daily up trend broken (blue). Price hit down trend 4H (Pink) showing two rejection candles. Price is at strong resistance zone (Dotted horizontal Lines) TP :...
Potential short Strictly very small position, cos time frame is D1 R/R = 1/4
short GBPUSD right now. R/R = 1/4 Strictly very small position due to bigger chart
NZDJPY broke down trend and now possible long position
R/R = 1:2.38 Broken Down trend and re-tested it , possible Inv H&S time to go long
Possibble doubble bottom in BTCUSD, Trend and neckline must be broken before entry
OIl completed its inv H&S pattern , buy at re-test


