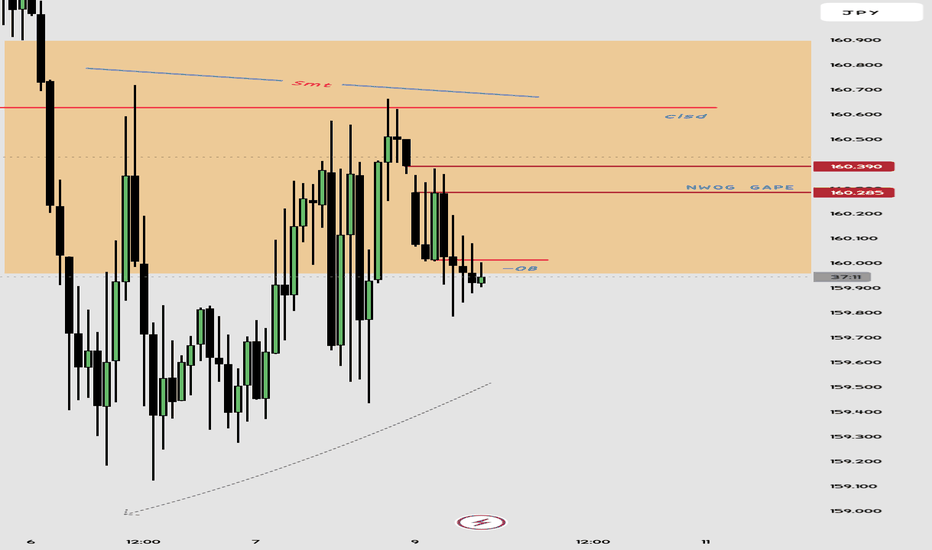
We can see that price is rejecting from CISD and making a SMt and nwog is already field so we can look clear for clear lrlr
The **EUR/USD Daily Chart** presents a clear **bearish structure**, characterized by lower highs and lower lows, with price respecting key supply zones. Recent price action shows a rejection from a prominent **supply zone** (highlighted in orange) in alignment with a **Trend Shift (TS)**, suggesting further downside potential. Key Observations: - **Supply...
From the image, here’s a breakdown of EUR/JPY based on the visible **Order Blocks (OB)** and the ICT framework: 1. **Bullish Market Structure**: - The chart indicates a **bullish bias**, as price has been reacting to daily order blocks (d OB) and respecting them as demand zones. The structure is stepping higher, with price reaching for liquidity above. 2....


