azmi12321
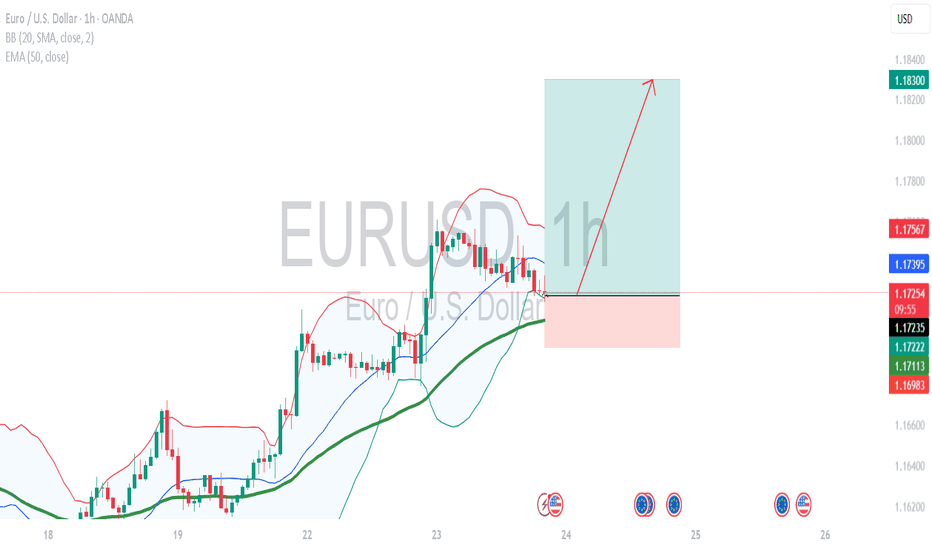
Daily candle closed with strong bullish. a healthy pullback observed earlier today during Asian & Europe session. I'm expecting a bullish movement in US session. i'm buying at current market price. calculate your own risk & reward. Good Luck
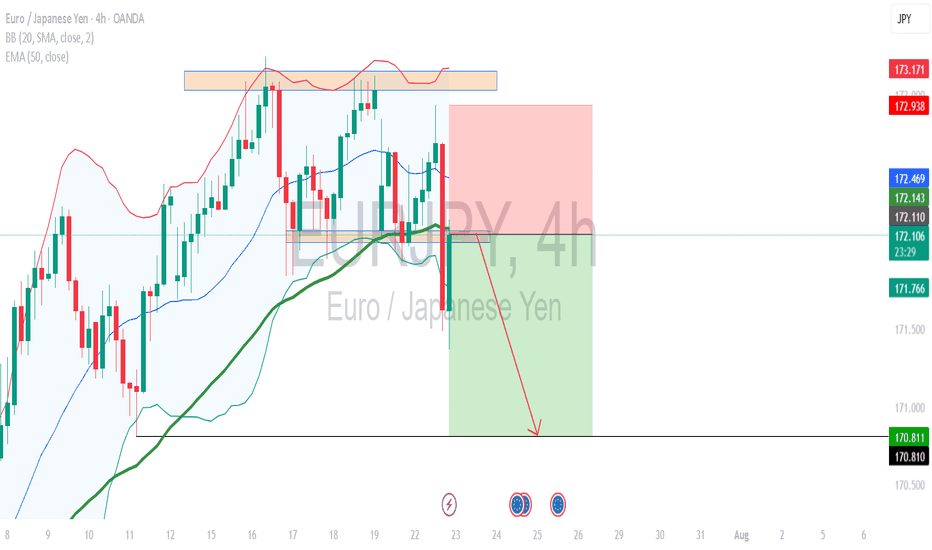
H4 Price action showing support has been broken. Seller started to stepping in. Now support become resistant. calculate your own risk & reward. Good Luck
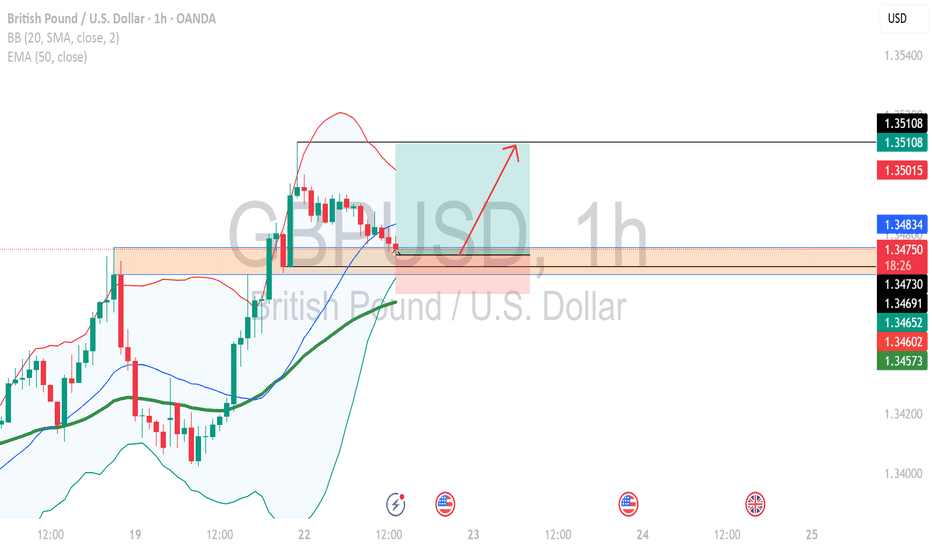
GBPUSD closed with strong bullish daily candles showing the buyers are stepping in. Let's ride the wave with current market price. calculate your own risk & reward. Good luck
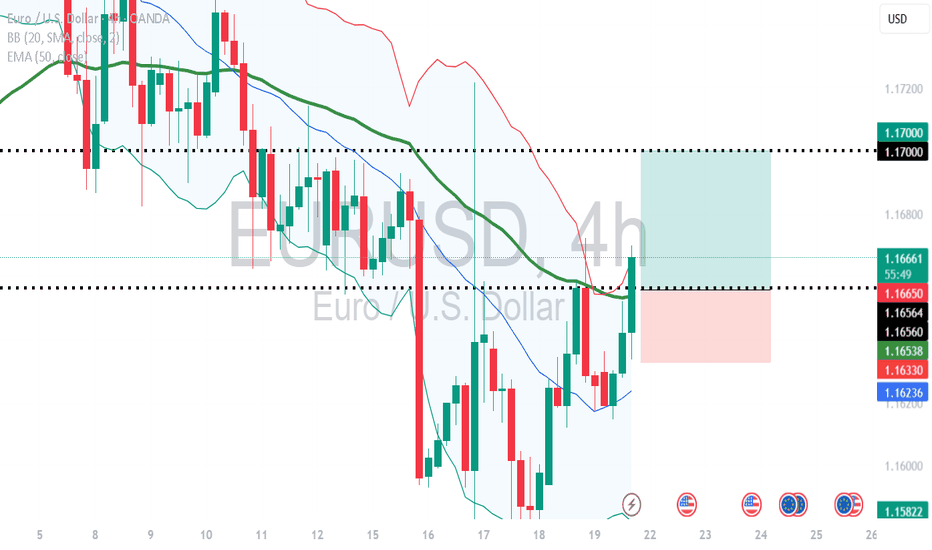
Base on today price action, we could see buyer is dominating the market. My plan:- wait at 1.1655 for any buy opportunity. calculate your own risk & reward. Good Luck
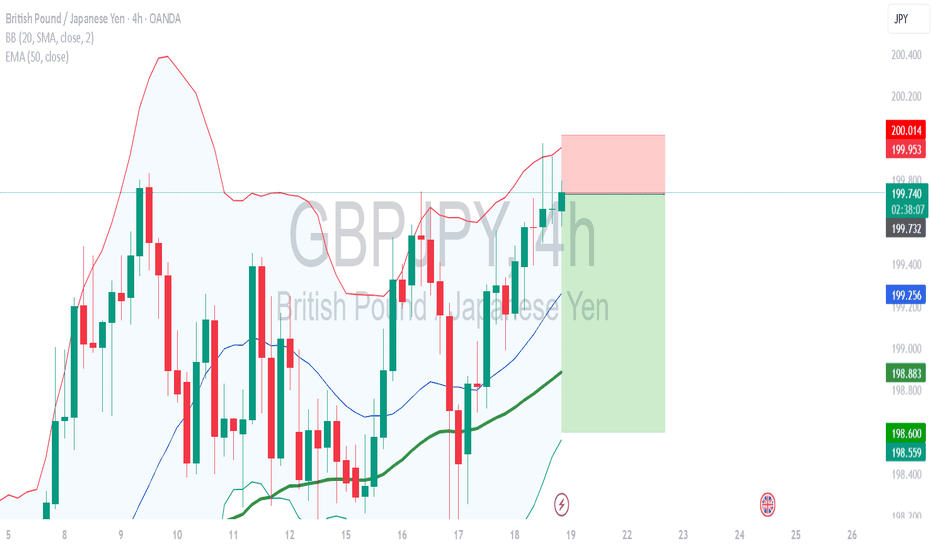
H4 candle closed in doji pattern, hint for buyer started losing the strength. i'm short at current market price. target to take profit at 198.60 calculate your own risk & reward Good luck
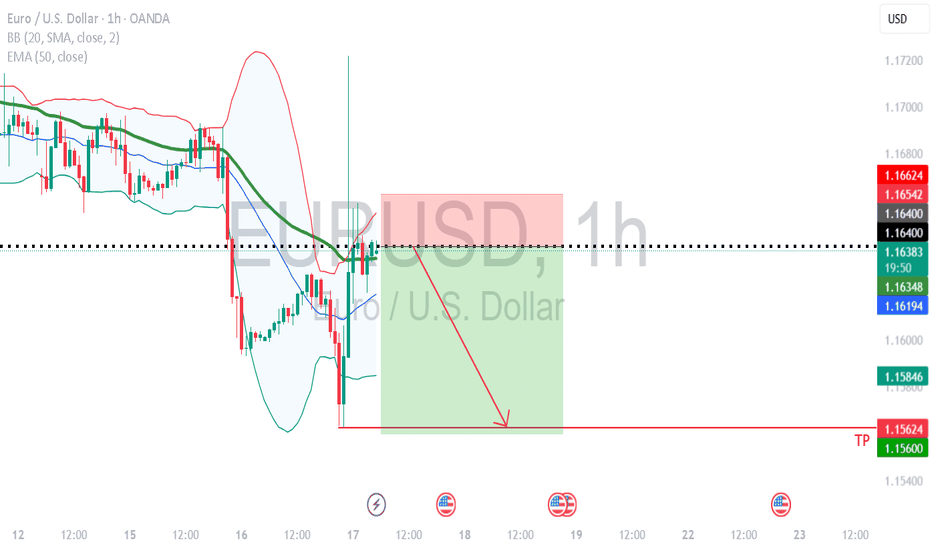
EURUSD made a strong rejection toward resistant which hint that it will going down again. I'm expecting a pullback toward resistant zone again. waiting confirmation price action in a lower timeframe for a minimum drawdown. good luck.
Based on candle stick pattern, i observed a clear bullish setup. I'm expecting the price will pullback to the entry zone. Intraday target will be TP 1. Calculate your own risk & reward. Good Luck
After failed make higher high, I'm expecting H4 to make a healthy pull back. Aiming at the lower Bollinger band price. calculate your own risk & reward. Good Luck ;)
After a solid breakout, i'm expecting healthy retracement before continue downtrend. Good Luck
Daily candle closed with strong bullish. Expecting a healthy retracement before another bullish movement Good Luck
Daily candle shows buyer in control. I'm expecting retracement today towards 1.1707~1.1733 before another bullish movement. Good Luck. do your own risk & reward calculation
H4/H1 break support. Now the previous support has become resistant. I'm willing to take a risk for short position. Good Luck do calculate your own risk & reward.
Based on Daily/ H4 & H1 price action, current market price is the best price to enter sell in my opinion. I'm predicted that price will close below 1.15 level at the daily close. This is my analysis, please calculate your own risk & reward. Good Luck & happy trading.
EURUSD is sideway now but based on my daily analysis, the trend is still uptrend. strategy:- I will wait at the mark zone for buy entry (I will monitor at H4 low BB area for any bullish price action). Good luck calculate your own risk & reward.
Yesterday's daily candle closed with very long wick hint for buyer in control in my opinion. today strategy:- Wait at 1.89000~1.89150 zone for any reaction. buy entry if have bullish price action in the lower timeframe. good luck. calculate your own risk & reward.
Due to strong bullish candle closed yesterday, today im looking for buy opportunity. Where to buy? Im waiting at 1.1400~1.141100 zone for bullish signal in lower timeframe. No bullish pattern, no entry. Good luck.
Monday daily candle closed as bullish engulf hinting that this pair is starting to going up. Where to enter buy? Zoom in into smaller timeframe 4hr, 1hr, 15min and wait for the buy price action. Personally, i would like to see the price to react at "Resistant become Support" zone that i marked in the chart. No price action in lower TF, no trade. Good...
EURUSD Friday daily candle closed hint to me that buyers are in control in my opinion. today strategy : waiting price to pullback at the marking zone in the chart. zoom in into smaller time frame for any bullish movement. good luck. calculate your own risk & reward.
