Hello traders, welcome back to my trading ideas. A hidden divergence has been formed on EURUSD 1 hour timeframe which could signal downtrend continuation after a little correction. here is my recommendations Instant entry/1.08310 SL: 1.08396 TP1: 1.08308 TP2: 1.07877 GOOD LUCK
Hello traders, here is another trading idea. A bullish regular divergence has been spotted on EURUSD H4 chart with price making a lower low while the RSI indicator making a higher low. This suggest that there are less sellers and more bulls in the market, or perhaps the pair is in a corrective phase after a series of downward trend. Trading recommendation Entry:...
Hello traders, it has been a long time writing here. Despite the Worldwide Inflation leading to appreciation of USD, A Regular Bullish Divergence has been formed on GBPUSD H4 and H1 Timeframe which could indicate the end of the downtrend and beginning of an uptrend. Thus, I will suggest traders looking for long opportunities on the Pair. entry point might be...
Hello traders, welcome back to my divergence trading idea. Today, EURUSD form a Hidden Bearish Divergence on the H4 TF as price had made a Lower High (LH) while the RSI Indicator had made a Higher High indicating price can move further down as the price is in a downtrend. Also on the H4 TF, price rejected the recent high trendline around 1.11203 which could mean...
Hello traders. As market open again tomorrow, here is a trade idea on GBPUSD. on the H4 and H1, the price makes a lower low while the RSI indicator makes a higher low, forming a regular bullish divergence as seen on the chart. Also a spinning top was formed on H4 TF which could indicate bears are exhausted. Thus, we can make our entries around 1.32331 (or lower),...
A hidden bullish divergence has been spotted on USDJPY H1 TF as price made a HL and the RSI indicator made a LL. Also, on the daily TF, we can see price is in an uptrend as price keep respecting the 100 day EMA. However, on the H4 TF, price has formed a double top which might indicate price shooting down, therefore we shall use a tight stop. We will go...
Following the recent strong bearish movement USDCHF have formed a hidden bullish divergence on the H4 and H1 TF. This might indicate bullish run will soon start. For now, price is testing the recent swing low (HL). If this level should hold, then we expect a break above 0.91221 which will further confirm the bullish run. Our SL is tight, placed at the recent low...
A regular bullish divergence was formed on AUDUSD H1 TF between January 01- January 7 2022 signifying price moving to the upside is imminent. The price form a lower low (LL) while the Indicator (RSI) was making a higher low (HL). Also on the H1 TF, it seems a new uptrend is forming gradually and the prior downtrend has ended. A break above 0.71832 (recent...
Hello traders, our trade is going on as planned, however with the current outlook on the EURUSD, it seems a double top is forming on the H4 TF (more visible on the H1 and H2 TF). This could mean buyers should be cautious or lock in some pips on the long trade. The 1.16400 is an important price to be monitored. If bulls are unable to push below this price, then we...
Hello, traders! Based on our EURUSD lookout, I emphasize that a double top formation formed on the weekly TF in which the neckline was broken. Right now, the price is heading to the neckline (around 1.17) for a retest (where we took our short-term long trade). Looking at the D1 and H4 TF, it seems the price is retesting the median line and the broken short-term...
Hello, traders! Based on our EURUSD lookout, I emphasize that a double top formation formed on the weekly TF in which the neckline was broken. Right now, the price is heading to the neckline (around 1.17) for a retest (where we took our short-term long trade). Looking at the D1 and H4 TF, it seems the price is retesting the median line and the broken short-term...
Hello, traders, it is another trading week, and here is a good trade setup on EURUSD. On the weekly chart, the price is heading to a major support zone around the 1.15 level. This level has not been broken since July 20th, 2020. Consequently, a descending channel was formed with price respecting the upper and lower trendline since January, 11, 2021. These...
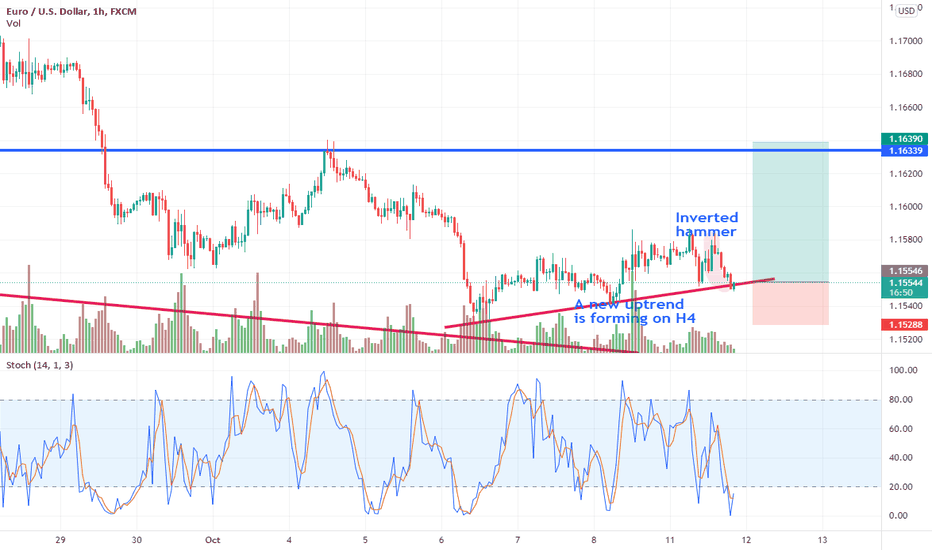
Hello, traders. As predicted, the EURUSD is facing bullish momentum, and our short-term target is almost achieved. Recently, EURUSD has formed a double bottom on the H4 chart and the latest candle seems to have broken the neckline at 1.1572 to the upside. This further indicates that bullish momentum is high. However because stochastic seems to be in the...
Hello, traders. Our EURUSD analysis was as predicted last week as the price completed its Double Bottom formation to the upside. This week we will look at the situation of the EURUSD, fundamental and technical analysis, bull and bear sentiments, and likely direction of the pair for this week, and, most importantly, look for good short/long-term trade. The fiber...


