bedarija
There is a nice chance we might see a short term uptrend back to 9500-9700 zone, before we move down any further. We hit the bottom of our daily price downtrend channel as well as our daily RSI downtrend channel. There is also a massive MA 200 in play which should hold for now. After the bounce upwards we should continue down a little bit pass the current low to...
Currnetly the 4h EMA 200 is holding the price above 7500$ but on a daily RSI graph we are still in a downward facing channel, until we break out of it we can't safely open long positions. My humble opinion did not change, we should go lower but we will see.
Daily RSI trend has been broken that has been controlling BTC uptrend since its bottom. We should get a nice retracement to EMA 100 or 200. You can never predict when its over until you can see on charts that its over
we are inside an ascending triangle that that will soon hit a strong downtrend line. this is where the future of bitcoin will be presented. my opinion is that we might get another low at the range of 5500-5600 before we test the downtrend. until than we wait.
MACD clearly shows that we are in a downtrend right now, but fortunately we have hit bottom at the moment which could suggest uptrend for 2-4 days depending on the speed of the climb. we have hit 7500 3 times allready and it seems this will be our low for now. After the climb and we hit EMA 200 bitcoin should turn back down again and hit that 7100 buy zone.
yes we could say that the bubble popped or you can say the correction is underway. in all this down movement for over 45 days now we see some bright light here and now and in my opinion this is the time. even though we broke first uptrend line (first blue line) not so long ago, we might get some up movement because we are on the low side of inner channel. if not...
we almost witnessed the flippening in July 2017, but it looks like ETH is at it again. BTCs slow transaction speed and big fees are bringing this old coin down. it had a good run, it will still be in top 10 and it will be good for store of value, but its useless in real life unlike ETH where number of contracts are growing exponentially. both coins are loosing...
if you hodld this little coin over from last year your christmas came early (like 355 days early). we have seen a nice bull run after that 225$ resistance and down trend combo breach, but i think that good news will stop for now, we are at another very persistent resistance that might bounce our coin back down to that 225$ mark. but before shorting wait for...
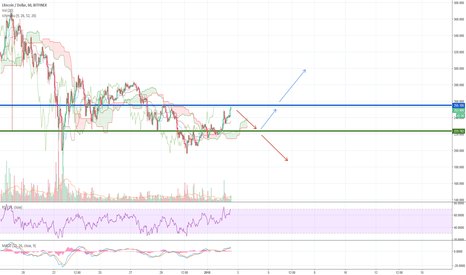
don't forget to write 2018 instead of 2017. there is no indication where this little coin will go at the moment, but we will get the answer before the end of this day. we can either breach top trend line and we start our year with bull coin or we can bounce back below 225$ and we will not stop till 200$. be patient wait for conformation and react according to the...
Happy new year guys, and wow what a rush this last day of 2017. LTC broke channel quickly volume is greater than the last few hours but its not as big as i would like it to be to confirm upward movement. but it looks like that our friendly little coin is forming a flag, its not yet confirmed but we could see yet another jump up so stay tuned, and save those...
can ETH separate from BTC influance and start gaining value even with BTC falling? RSI and MACD are completely neutral, selling pressure that happen few hours ago was quickly suppressed and we are back inside consolidation zone that is running out.
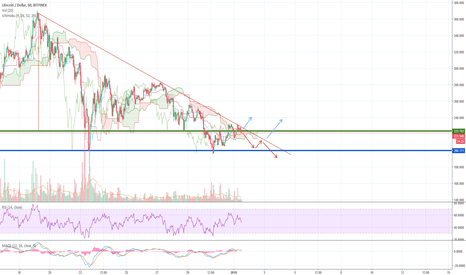
so we have breached 225 support and it now became our resistance. selling pressure was strong when we hit 200$ but never the less we quickly jumped back into the channel and the same thing happened at 225$. buying pressure was strong but we bounced back down again. that was classic bear trap, if you didn't wait for candle to close above 225$ resistance and you...
1H graph for LTC looks like one giant descending triangle that will bring sadness to people still HODLing this coin. i think that we might see this coin fall to 200$ if it breaches resistance at 225$. that can happen in few days and than who knows where we will go from there. upward movement is also possible if it breaches top trend line with nice volume, which...
Like i said in my previous TA, bounce from support was not supported with great volume, and over time descending triangle formed and it pushed price bellow the support line, great for SHORTing. now we have a new formation, that could be a downward facing flag and we could see another corresponding dip.
LTC broke consolidation few days ago, now it broke uptrend again, so we will touch previous consolidation line which will determine where will our new trend go
LTC broke channel and will hit major support, wait for conformation, if it bounces up again we will see steady growth over next week, looking at RSI and MACD is also neutral. if not new bottom support will need to be found


