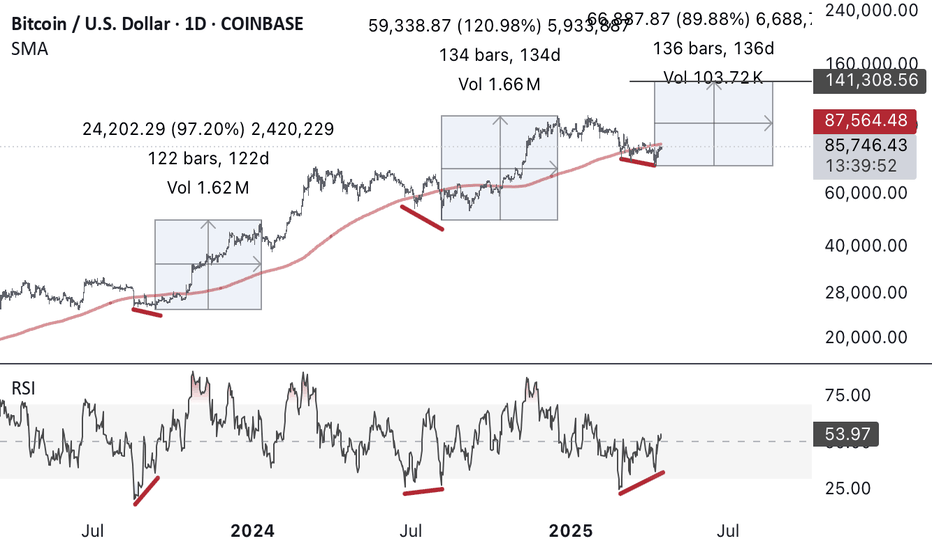
BTC oversold on daily timeframe formed regular bullish divergence. Tariff war makes perfect panic selling. Last 2 times it happen price went up almost 2x. Price was grabbing liquidity under 200 day MA. It was good place to add spot for long term hold. Now expecting some good times ahead, if something terrible doesn’t happen.
NFA, DYOR. Last time ETH was forming a POTENTIAL right shoulder and did not break to the downside. Now, we are forming a similar pattern as the last time before the crash. I do not say it will repeat exactly as before, but this is an interesting view from my angle. Double regular bearish divergence on the 4H timeframe just under the main pivot point 1727$, and...
NFA, DYOR We have a potential formation of a head and shoulders pattern on 4H timeframe. RSI is showing divergence. Volume is decreasing. If played out, a measured move to this pattern can bring us back to the 1320-1350 $ range (MAJOR SUPPORT). We have also a support box (fib levels) for potentially buying the dip for the next leg up after we can expect a little...
NFA, DYOR. Price is broking the descending downtrend line (red). If it closes above it, it can continue to the next resistance (pivot high) at around 4100$, and then 4200$ and 4320$. Price is above 21 EMA, and 50 EMA, both pointing up. RSI>50, favoring longs. Stay safe.
NFA, DYOR. We are on the previous swing low, which acts as resistance for now. We faked a breakout, (not confirmed on a daily TF). Price is forming a symmetrical triangle, after a bullish impulse, which is consolidation for a continuous move up. If the price closes above the upper line of the triangle, it can easily go up to resistance above (zone in between red...
NFA, DYOR. We have reached the supply zone (red box). Price is highly overbought on all timeframes, correction is what we all expect, to track new buyers to push price more upside. I would take some profits here (not closing the full position if I bought somewhere below). I would not be a buyer here right now. We have divergence on RSI, visible on Daily and 4H...
NFA, DYOR. This is UNIUSDT on 4H timeframe. We had an impulsive wave down on PPI data release, that broke the support ascending trendline. Now we are forming a bearish flag under it, and if it breaks down, as expected, it could quickly go to a measured level down; red box below. We already took the range high, so lower levels are expected for now. Stay safe.
NFA, DYOR! Price has broken the downsloping resistance trendline (dotted), retested, and bounced from it. Price has also broken the 0.373, which was support at first, then resistance, and now bulls are trying to flip it as support again. We have a potential new support trendline forming (dotted). Price is above 200EMA on 4H timeframe. RSI is overbought on 4H, but...
NFA, DYOR Today is CPI are coming, expect volatility. Price is compressed in tight range. We are on major resistance (previous support-red lines), with descending trendline, and overbought RSI on daily with hidden bearish divergence. I would not buy here, only if price breaks all this and came back from retest. More possible scenario is the price come back to...
NFA, DYOR Price has broken the support zone at 250-258$, now testing from bellow, as resistance. No bullish price reaction for now. Volume is low. We have a potential downtrend line forming (dotted line). Lower prices are expected if the price does not get above the red lines.
NFA, DYOR. Price around 200 EMA on 4H timeframe. Bearish divergence on RSI. Triple top just under the supply zone. Testing trend line with no bullish reaction for now. If the candle closes below this line, short seems logical. TP on swing low and 4H demand.
NFA, DYOR!!! On lower TF, ETH is moving in a symmetrical triangle, which is often a continuation pattern; the previous impulse was down, so expecting lower prices. If the price goes up from here, I think 1380-1420 zone will be hard resistance to break. The dollar is oversold, SPX and US30 are overbought after an epic rally, indicating that the dollar will go up,...
NFA, DYOR, wait until you see the market sentiment, if we have bullish confirmation in the following week, I will open long on AVAX, targeting 4 profits here. Already broken out from descending vedge, have daily bullish divergence into daily demand zone.
NFA, DYOR. Price is moving down in the channel. 21 EMA is below 50 SMA, pointing down. RSI is negative(41), but has more room for downside before the potential bounce from previous support and 200 EMA.
NFA, DYOR. Everything is on the chart. We are almost overbought on 4H RSI, expecting a drop soon. Have good luck, and trade smart.
After a successful short after bad inflation numbers and a closed position with a 12% profit, we are in a situation where we can potentially go long IF we see a bounce from the blue box. You can see on the chart that the blue box is between strong horizontal support and 0,618 Fib from potential wave 1. I'm not bullish, especially in this economic situation, and I...
NFA, DYOR. Everything from my perspective is highlighted on the chart. Have good luck!!!
This is not a trading idea, just a general longer-term view of the current situation. Price was moving in the upward (blue) channel, now that channel is broken to the downside and the price is forming a new one(red) in the down direction. The major trendline is also near above, like 200-day EMA. The question is: Which channel breakout do you follow? If you are...


