br414n.gr1ff1n
Volume decreasing and an important resistence has been touched
Iperbolic movement , I think will hit the 200 mma before the fall to the trendline
Ntgas : the triangle it was inside has been broken
Channel has been broken and interesting insider trading
This is the actual condition I can see on the gold from 2016 to 2018 be careful to the trendline
SP500 incereasing while volume decreasing
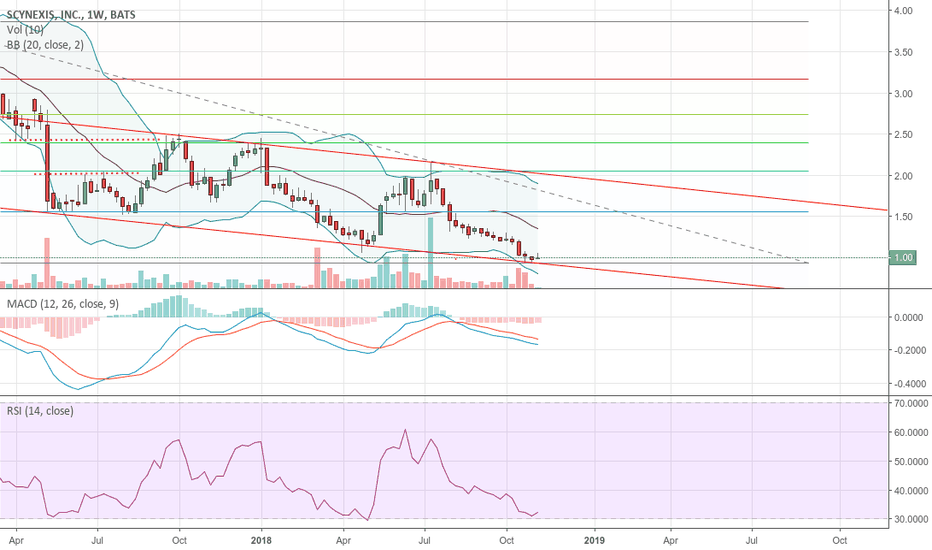
Resistence ahas been touched now it's time to restart , as you can see there is a bullish divergence on RSI
-the titile is moving on the bottom of a ascending channel -on daily is forming a double bottom
The candle let me think that the title will touch the upper level
Forking it and seeing MACD , I'd suggest a Long position


