braddles69
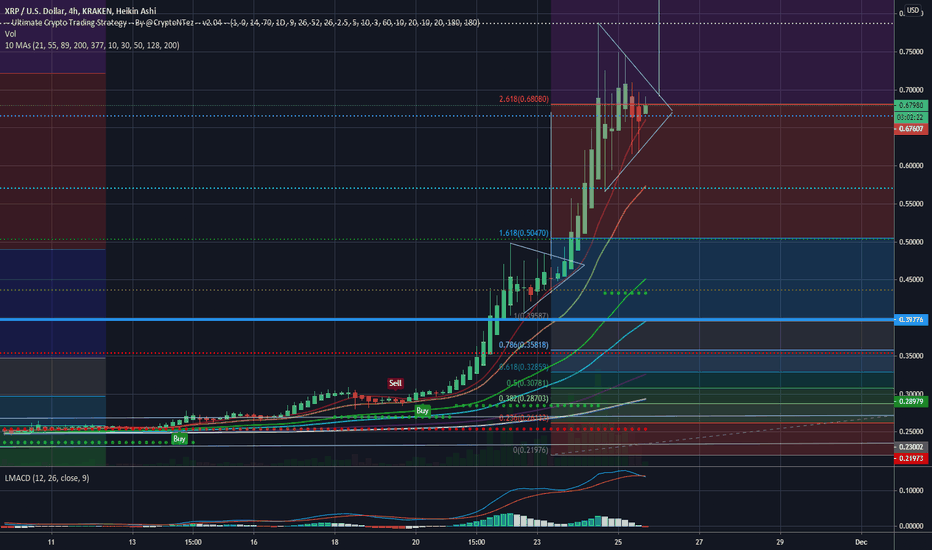
Breakout of the triangle to the upside should hit the 96.6 cent target...scroll to get there , enjoy
Hi all, Just taking a quick look at the XRP/USD 4HR chart, and noticed this symmetrical triangle forming, and then also noticed there was a larger one as well, the first looks nice to approach 24.35 cents, (confluent with a fib 0.5) and then second could take it to 27.78 cents, as always dependant upon BTC, but $XRP does seem to be wanting to find it's stride...
Having a good look at the charts, I drew the trendline from 2nd High of Jan 18, and the baseline from weekly close 17/4/17, and from how it looks with multiple tests and rejections and even long slow slide (yes XRP loves that one...;) along the downtrend line, I believe we actually broke out from this trendline 7 days ago, and have since retested it twice. ...
This is my first foray into charting (be gentle)...;) Looks like the price action is aligning well with the channels above, has just droppped out slightly from the median channel, only on low volume I would expect it to hover here for the next day or two and then maybe break to the upside, needs good volume to overcome a confluent resistance at $95, but the...


