chaching23
Both are almost 100% correlated currently. Both have currently broken out of a wedge to the upside.... bull market lives on?
oil is currently in a strong uptrend in 2018. Look for oil to peak in the high 70's then make it's gradual fade over the next 4-6 years.
bitcoin did close above the 9800 area. although volume has not been convincing of late. currently sitting under resistance. look for a break out to 12000 or the slow death of bitcoin
Still not completely bearish on the market but a completion of this head and shoulders pattern could be the official start to the bear market. dont fear the bear, tame it. Still maintaining my original game plan of the big bounce then smaller bounce off the larger triangle on the daily chart.
hitting this recent trend line on the 4HR chart. watching for a pullback on sunday night futures.
current inverse hammer signalling a potential trend reversal.
Consolidating here. currently curling of lower support line on 3H chart.
The HANG SENG index sitting at it's final support. Now is the time it breaks upward or falls through and takes these shakey markets south.
broke out of the large triangle formation. now curling upward. a break over 9900 here could see a continuation of the bullish trend forming. Next resistance 11500-12000
SPX500 playing out as planned. the bounce was bigger than expected. Break down of this few month triangle could be the signal or a larger market pullback or bear market start. overall market is sideways until then
Gold bouncing off support here. has been consolidating for a few months. could break over 1400 on this run
Tech has been all over the place as of late. AAPL is at resistance of downtrend here. A break out and confirming the continuation of bull market or more signs of the start of a bear market post ER.
Nice long set up here and a good hedge to hold over the weekend. Triangle forming in this as well as underlying VXX. under 15 would allow for a very tight stop.
Didn't commit on the first buy opportunity, enter long on a break above the past few days of consolidation. Strong volume to confirm on 4/26
The continuation of the down trend could have it's start here on the 2HR chart. Watch for change of trend here with the bigger picture of the overal sideways action and volatility of late.
Seems to be at a potential resistance level for the nikkei.
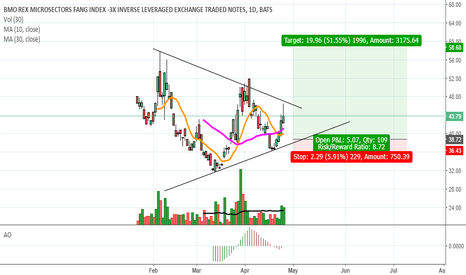
The US market has been volatile of late. This is the risky 3x inverse ETF. Looking for a pull back to sub 40 before a potentially big bounce with the tech stocks showing weakeness


