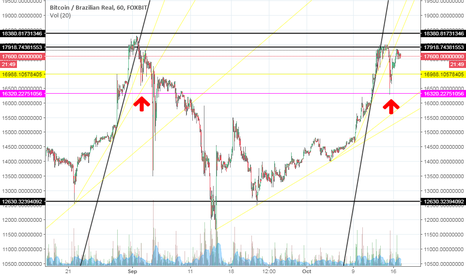
Moving averages showing signs of soon to be reversal of trend.
If BTCBRL is in any way a proxy to BTCUSD, we are seeing a correction that may set BTC value back to $4500 values, considering USDBTC ~ 3,15. The pattern is very similar to what happened 45 days ago. By that time, it was FUD, this time, it is probably the hardfork.
The market today is different from what it was during the last "all time high", but we may be closing in another price correction according to previous trends. I just don't think the fall will be so hard. Bitcoin has been proving to be stronger than mainstream media advertises.
BTCUSD has broken resistance from previous trend but without volume. It may be a final squeeze. Either way it's not easy to hold this inclination. We will probably see a correction in a day or two before going up again. My target is $4970 and current price is $4880. I'll keep watching for now.
Still not enough momentum (decreasing volume) to break resistance (top black line) and start a new bullish trend which should be occurring right now. I believe Hard Fork and Segwit2x are causing this. Stay tuned for further details. news.bitcoin.com
Resistance at $4300. Support at $4150. We have a bullish figure confirmed by the 4H chart but the lack of volume gives no confidence to this trend. Perhaps another shoulder is coming. What do you think?
Next support at $4150. Confirmed from previous trends. If it breaks, the next one is around $4000.
I just wanted to point out a pattern that is emerging within BTCUSD graph. It's forming a new support around $4000. Resistance at $4200.
Falling, nothing more than falling Trying to forget my falling from the top Teardrops rolling down on my face Trying to forget my falling from the top www.youtube.com Have a good day. :)
BTCBRL is cornered between support and resistance. If it breaks resistance, chance of gains of R$500. If it breaks support, chance of losses around R$500. How's your hunger for risks?
BTCUSD is over a support at $3900 and is limited by a resistance as shown in the graph. The next support is at $3700. Gains around $80, losses around $200. Better go short now.
If we apply Elliott Waves over SPX historical data, we are due to another crash. The reverse zone should be around SM300 if it follows previous tendencies. US Government Debt to GDP ratio confirms the problem. The first two crashes are similar because Govt Debt/GDP was similar. Now Govt Debt/GDP is 80% bigger. BTC and USD should increase value during this crash.
Bitcoin remains in its descending trajectory. Volume, MACD, AO, RVGI confirms the trending. Support around $3600 was broken. The next one is around $3200. Since it is not a very strong support, probably it will stop around $2600.
Bitcoin is being tested this month. The pattern may reverse if the resistance of the yellow line is broken. Otherwise, I believe we will see it reach ~ $3000 levels again very soon. Brace yourselves.
Due to the increase in Debt/GDP of the world's biggest economic markets, the BRICS, and specially Brazil, that is impeaching its left wing corrupt president, are good options for those that want to escape from the bail ins and outs of the european market and from the chinese bubble. Obama's economic policy is also putting US in a very delicate situation. In...


