1.12700 is a nice round number for a resistant level. Price has break the support level recently and I'm expecting the price to retrace to 1.12700 resistant area. I'm also expecting the price to be rejected by the level (first touch). I would go for a short position after price has reached the new resistant level.
Price has reached support level. CCI showing very low values and showing divergence. Expecting price to go up reacting to the support level
Wolfe Wave Characteristics: The Symmetry of Waves 1 to 2 is the same as waves 3 to 4 If wave 2 is sharp then it would find support at wave 2 of 1, and if it was flat then it would find support at the Wave 4 of 5 if 5 was extended, or at the main wave 4 itself if wave 5 was not extended then it would find support at main wave 4 of the same degree The Waves 3...
Price has breached previous resistant level and now the purple line acted as support level. wait for the Heiken Aishi to turn blue before going for a long position
Bullish Wolfe Wave is found and currently is at Point 5. Wait for price at point 5 to reverse and bounce upward on the 1-3 line before going long. Target profit line is at 1-4 line.
Bearish Wolfe Wave has been formed and point 5 is extended from 1-3 line. Look for last kiss setup as a conformation before going short.
Bearish Wolfe Wave is found and point 5 is already extended.from 1-3 line.
Bullish Wolfe Wave is found in EURGBP. Currently point 5 is still not breaking 1-3 line. Expecting price to breakout a little to 127% or 162% Fib entrancement.
Price just broken previous resistant zone (red box) and showing reaction to new resistant (blue box) and the price is moving down. I'm expecting this price will react to the new support zone (red box) and shoot up to resistant zone (blue box). Set your buy limit order properly inside new support zone. Expecting profit target of 600+ points.
Previous support is now resistant at yellow zone. Expecting price to shoot to blue zone for take profit. Use Sell Limit order for this setup.
Previous resistant is now a support at 120.500 (round price number). Is in uptrend as indicated by moving averages and trendline.
EURJPY: Strong bear candle appear after price touched trendline. Bearish candle is 299 pip in height, the longest among 6 previous candle. SL is placed at the top of the bearish candle.
Im expecting the price will follow the arrow i just drew. price tend to move slower at "Base" ("Base" from "Drop-Base-Drop" marked in blue box). However, after the price breaks the "Base" level, i'm expecting the price will move up to the red box. Price however can break this red box resulting more profit. Try using trailing stops when price has reached red box. Thankyou.
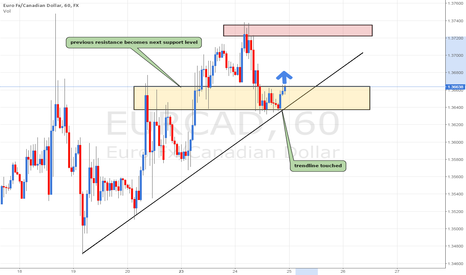
EURCAD UP-trendline touched. starts to rally previous resistance level. target is red box.
- CCI indicating overbuy - While main trend is downtrend (as indicated by 2 SMA 50 and 100) - Currently price have reached supply level and im expecting the price will go down
- CCI is showing overbuy - Supply level is touched and price is already showing reaction - Please use stoploss or hedge at supply level - Target is at Demand level (almost 1400 pips)
- Price is at highest peak and still respecting the trendline - CCI showing overbuy in a downtrend - supply level found and touched. price is showing sign of reversal
Andrews Pitchfork placed since in November and price seems to still respected the main trend. - Fresh demand level is found and price already reacted to this level - CCI showing oversold - 2 fresh supply level is found.


