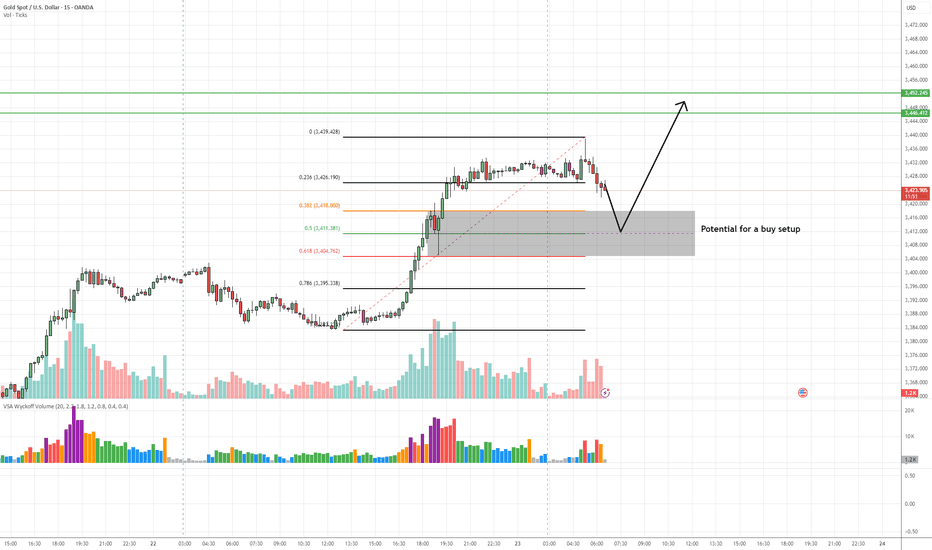
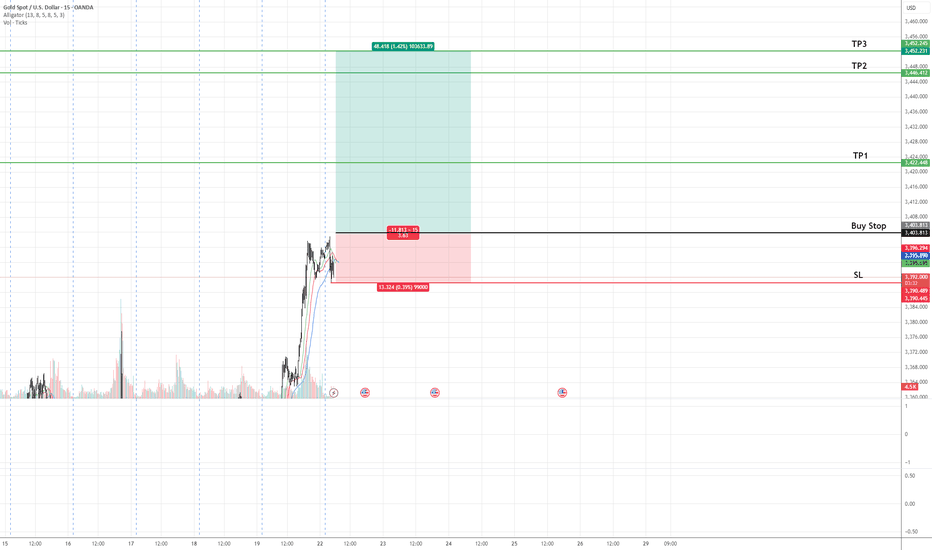
✅ Entry Zone: 3,411 – 3,404 (Key demand zone + 50%-61.8% Fib retracement) 🎯 Take Profit 1 (TP1): 3,446 (previous swing high) 🎯 Take Profit 2 (TP2): 3,452 (extension target above resistance) 🛑 Stop Loss (SL): Below 3,404 (beneath demand zone to avoid false breaks) 📊 Technical Insight: Climactic volume seen on the initial rally signals strong professional interest...
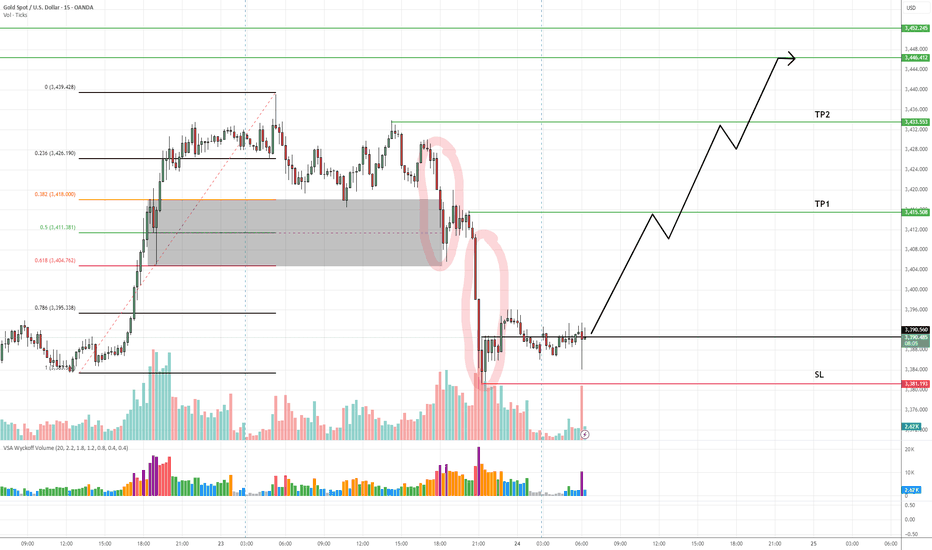
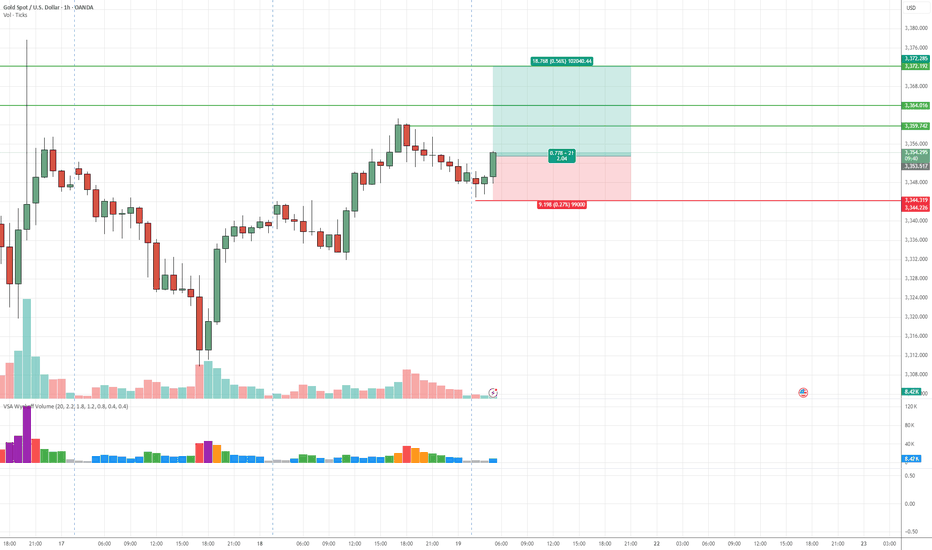
✅ Entry: Current price action (around 3,392) 🎯 Take Profit 1 (TP1): 3,415 🎯 Take Profit 2 (TP2): 3,446–3,452 🛑 Stop Loss (SL): 3,381 (below the confirmed demand zone) 📊 Technical Insight (VSA-Based Analysis): The sharp markdown into the demand zone occurred with expanding volume and wide spreads, a classic sign of stopping volume—potential smart money absorption...
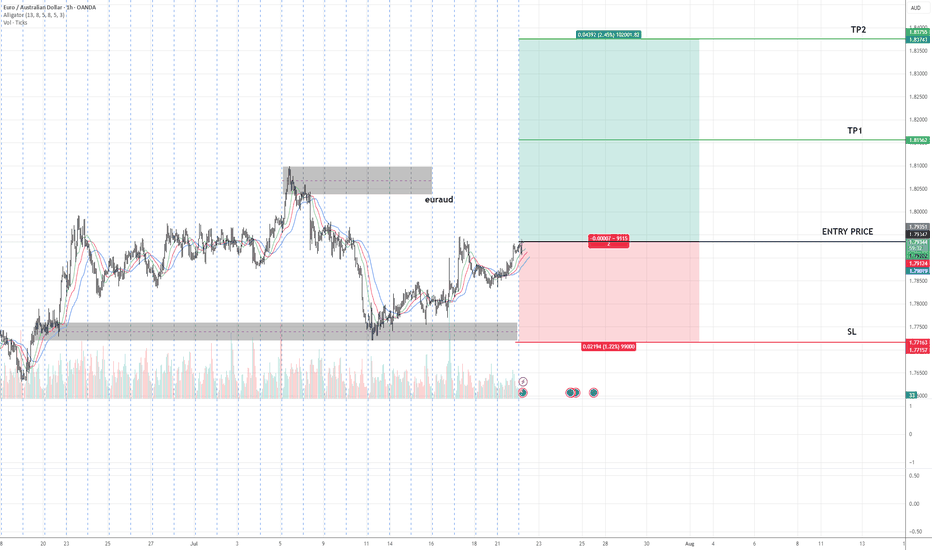
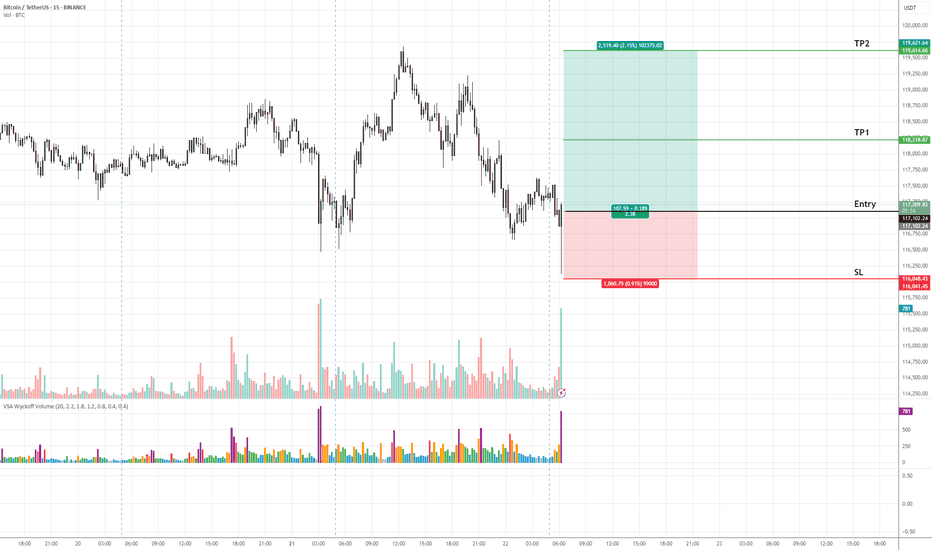
Entry: As marked on chart 🎯 TP1: As highlighted on chart 🎯 TP2: As highlighted on chart 🛑 SL: As defined on chart 📊 Technical Insight: Price has completed a higher low formation, indicating the potential start of a new uptrend phase. The market has shown an accumulation phase followed by a breakout above minor resistance, suggesting strong demand at current...
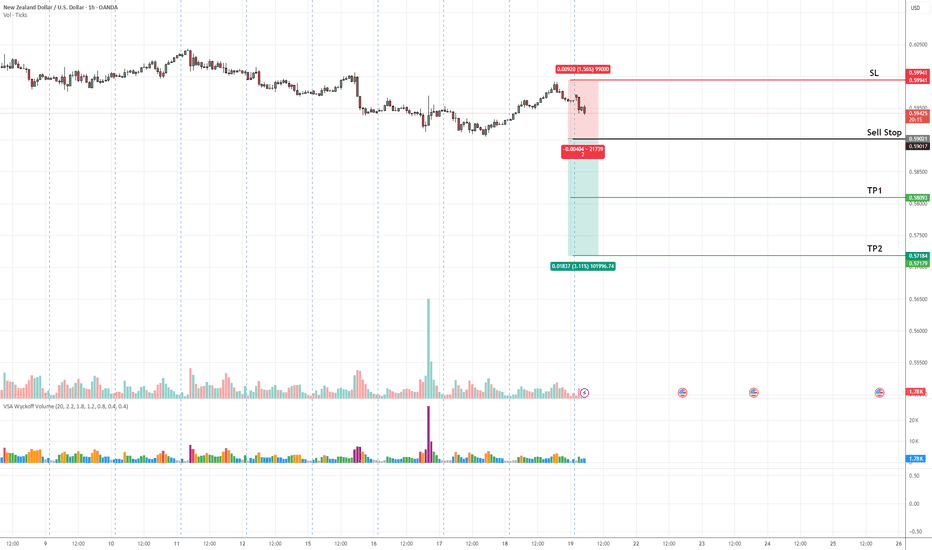
NZDUSD is in a clear downtrend, forming lower highs and lower lows. A sell stop is placed below the recent support to confirm bearish continuation. Sell Stop: 0.59 Stop Loss (SL): 0.60 Take Profit 1 (TP1): 0.58 Take Profit 2 (TP2): 0.57 Waiting for price activation to validate the setup.
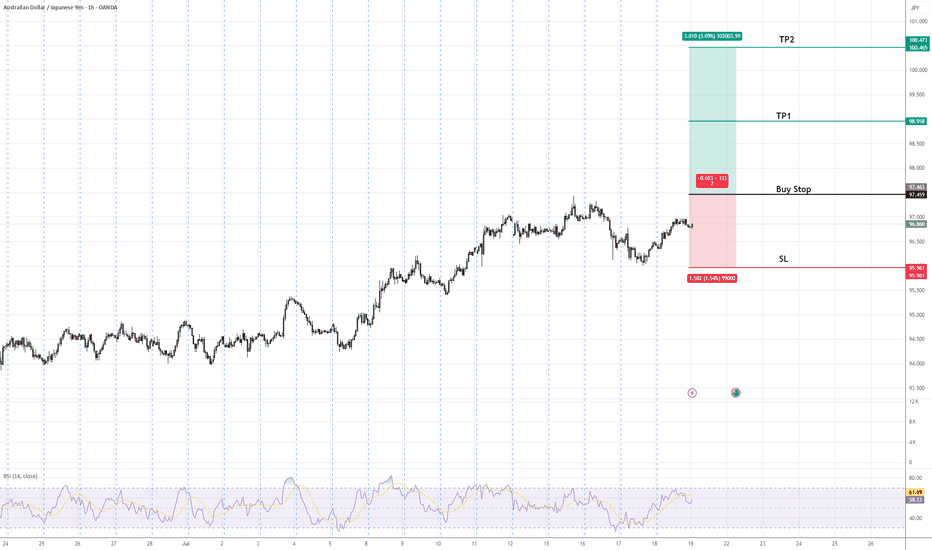
AUDJPY is in an established uptrend, forming higher highs and higher lows. A buy stop is positioned above the recent swing high to confirm bullish continuation. The setup includes a defined stop-loss below the previous higher low to manage risk and two target profit levels (TP1 & TP2) aligned with key resistance zones. This approach favors trend-following traders...
✅ Entry: As marked on chart 🎯 Take Profit 1 (TP1): Highlighted on chart 🎯 Take Profit 2 (TP2): Highlighted on chart 🎯 Take Profit 3 (TP3): Highlighted on chart 🛑 Stop Loss (SL): Defined below recent swing low 📊 Technical Insight (Dow Theory): Gold is currently in a primary uptrend, confirmed by a series of higher highs and higher lows on the daily chart. Recent...
✅ Entry: As marked on chart 🎯 Take Profit 1 (TP1): Highlighted zone on chart 🎯 Take Profit 2 (TP2): Highlighted zone on chart 🛑 Stop Loss (SL): Defined below recent demand zone 📊 Technical Insight (VSA & Market Structure): The recent decline into the support zone occurred on diminishing volume, indicating a lack of selling pressure. A climactic volume spike...
Gold is maintaining its bullish momentum, with price action respecting key support levels. The chart highlights three target levels (TP1, TP2, TP3) marked with green lines, indicating potential zones for profit-taking as the uptrend progresses. A stop-loss is defined below the recent swing low, marked with a red line, to manage downside risk. This setup aligns...
GBPJPY continues to exhibit strong bullish momentum, with price action aligning with the prevailing uptrend. The pair is projected to advance towards the identified target zones (TP1 and TP2) as marked on the chart. A stop-loss level (SL) has been defined to manage downside risk effectively. Traders are advised to monitor key support and resistance levels for...
On the H4 timeframe, GBPUSD is currently approaching identified selling zones, specifically Zone 1 at 1.2614 and Zone 2 at 1.2660. Anticipation is for a downward price movement initiating from either of these zones. Projected price targets include: Target Price 1 at 1.2447, expected to be reached within the forthcoming week. Target Price 2 at 1.2301. We will...
Technical Analysis of EUR/USD: Current Trend: The EUR/USD pair is demonstrating a bearish trend across multiple timeframes, specifically observed on the Daily (D1), 4-Hour (H4), and 1-Hour (H1) charts. Key Price Levels: The price has repeatedly tested the resistance level at 1.06, with three significant touches, effectively absorbing available liquidity...
GBP/JPY has tested resistance levels on the 1-hour and 4-hour charts, initiating a downward trend. Place a stop loss above 188.25, and set take profit levels as indicated on the chart. According to Volume Spread Analysis (VSA), a high-volume bullish candle followed by a high-volume bearish candle that doesn't break the high of the bullish candle is a strong...
US Oil has bounced back from support with high-volume candles, nearly testing the support level. The price is expected to start moving in a bullish direction. Target profit prices are marked on the chart, and with the stop loss at the designated level, we anticipate a favorable risk-reward ratio for this trade. Updates will be provided daily.
Here are the indicators for a short trade on GBP/USD: Double Top Formation: A double top pattern has emerged on the 1-hour timeframe, signaling potential bearish reversal. Volume Spread Analysis (VSA): VSA suggests a high likelihood of price decline, provided the price remains below the double top resistance level. Target Projection: The target is clearly marked...
**Technical Analysis: Bullish Outlook for GOLD** Gold has completed a healthy retracement with high volumes. The presence of no-supply candles on the 15-minute and 1-hour timeframes indicates a potential upside movement. There is a chance of testing the current zone again before a clear upward movement.
**Analysis for GBPCAD Short Trade:** - **Volume Spread Analysis (VSA):** VSA suggests a downward move for GBPCAD, indicated by high volume and impulse buying candles. We will wait for a no-demand candle with low volume or an upthrust candle with low volume to confirm the entry. - **Entry Confirmation:** The probability for a sell position is high, provided...
Gold is preparing for a retracement upto 2344. We will enter the trade at current price with a stop loss below the recent low of 2315. Will update as London and New York opens on Monday 24 June
Bearish divergence is in play on the daily time frame, and the price is expected to retrace up to 650 before moving upward. Let's see how it plays out in the next few days.
